Trading with Power Trades Scanner. The ultimate guide for Order Flow traders
Navigation
Whatever the type of trading instrument — stocks, futures, currency, cryptocurrency — the entire trading process is focused on an attempt to predict the future price of the asset. As a result of this competition, traders develop new ways of price analysis based on historical and fundamental data. But is it possible to have a trading advantage in the market and how to achieve it?
Before answering these questions, let's take a look at the market from the point of view of the order flow, which constantly influences the price movement of the asset. As new information comes to the market, participants (including algorithms) adjust open positions, place new or cancel existing orders based on expectations of the future price movement.
Moreover, the market can be irrational and act against objective and fundamental reasons. This is because the price is a reflection of the total mood of market participants, which can quickly change. Therefore, it is important to understand at which point in time the market situation will change, and under which conditions the advantage will be in our favor.
But first, let's consider the concept of Order Flow and how to use it together with the Power Trades scanner.
What is Order Flow and why it’s important?
Order Flow describes the ongoing price movement based on the orders that are flowing into the market in regards to the available momentary liquidity at each price level. It is a continuous process of placing, modifying, canceling and executing orders by market participants. Each of these actions affects not only the current price but also the expectations of traders regarding the future price of the asset.
For example, if order with a large size appears in the Depth of Market, the price is likely to reach this level and the order will be executed. This happens because the price tends to move towards high liquidity levels, i.e. to the zones of limit orders accumulation to meet consent between buyers and sellers. The market is always attempting to reach for a balance market distribution to facilitate the trades between buyers and sellers.
How orders are executed? Basic terms and explanation
Prices move only because of market aggressivity (market orders). Without aggression, the market would stop at the current best bid/ask price and never leave that state. It is important to understand that in the market auctioning process for every buyer there is a seller otherwise the auction cannot take place! Thereby it is nonsense to state that is at any given time there are more of either. For a market to move there has to be an imbalance overwhelmed by either side willing to show more aggression.
How is the order executed?
Based on the trading rules, there are two main types of orders in the market:
- Limit orders, which are liquidity or fuel for market movements represent resting order pending to be filled (passive orders).
It is important to understand that liquidity exists only at a better price than the current one. Therefore, sell orders are always higher than the current price and are called Ask or Offer, and buy orders are located below the current price and called Bid.
- Market orders, represent market aggression and are the market constituents that drive the price either up and down.
Zones showing a substantial size of resting orders (limit orders) create barrier levels of liquidity (support and resistance levels). Those barriers will stop any further movement with a lack of aggression. Indeed for the price to move through those levels, liquidity has to be filled first though market aggression! This is the reason why prices tend to move sideways around those levels until either side overwhelms.
For a price to move higher buyers need to be aggressive and start lifting the offer. This trade is executed on the Ask/Offer Side. This price will continue moving higher as long as there are MORE aggressive buyers then passive sellers
For a price to move lower the sellers need to be aggressive and start hitting the bid. This trade is executed on the Bid Side. The price will continue to move lower as long as there are MORE aggressive sellers then passive buyers.
Market executions come in pairs:
- An aggressive buyer gets filled on a passive seller,
- An aggressive seller gets filled on a passive buyer.
Let's consider a simple example of how orders are matched and executed. For simplicity reason let us start with an empty Depth of market with no liquidity on both sides.
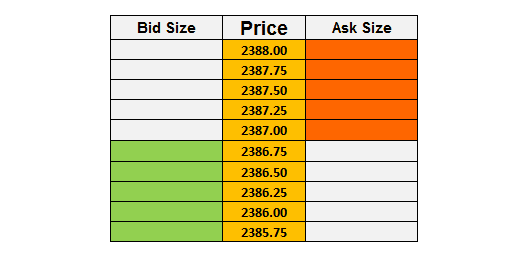
For example, there are two buyers on the market who placed limit orders for buying on 37 and 84 contracts with the price at 2386,75 and 2386,5 in accordance.
A few minutes later two sellers step into the market and also placed limit orders for selling for 53 and 12 contracts with the price 2387 and 2387,25 in accordance.
As a result, we see offers on every side, but none of these orders cannot be matched between each other, because sellers’ and buyers' wishes do not coincide. Now imagine the trader, who agrees to the sellers' offers and is ready to buy 45 contracts at a market price. This is the aggressive buyer, who doesn't care for the price but cares about the fact of orders execution.
The best price offer by the seller is 2387, which is equal to the price of the last trade. After the execution of 45 contracts, the price has not changed, because there are 8 more contracts for this price (53-45=8).
After a while, another trader has decided to sell 22 contracts at a market price. At the current moment, the best price for selling is 2386,75, with 37 limit orders on it. As a result of this trade, the price has moved for one tick from 2387 to 2386,75, and 15 limit orders still remain (37-22=15) and stop the price of the further decrease. It is necessary for a market order to execute the remaining 15 contracts, for the price to decrease.
The Map of Order Flow
Candlesticks only allow you to follow the historical price change without in-depth knowledge about the actual liquidity presented at those different moments. Markets are in constant auctioning for multiple reasons (HFTs, Hedging, Spreading, Swinging, etc.) so that the liquidity is constantly changing. But tracking changes in order sizes at each price becomes difficult when the number of levels in Depth of Market reaches several hundred, as in the crypto market.
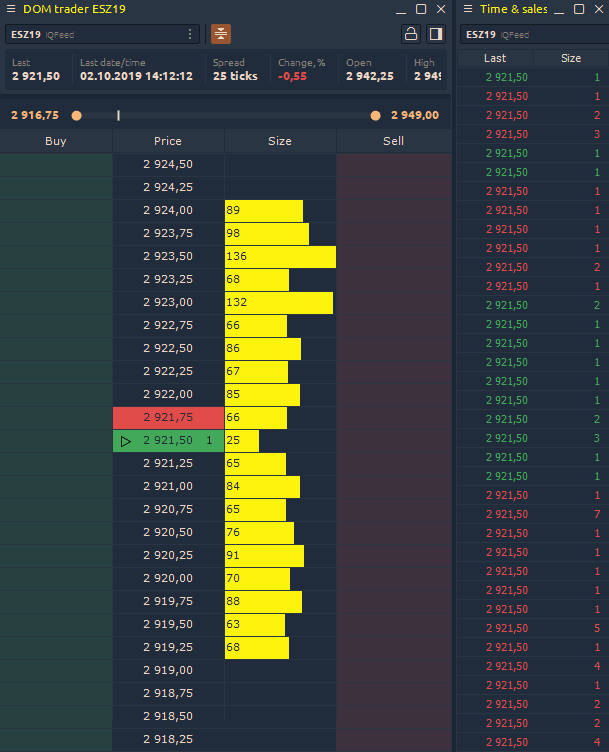
Therefore, the DOM Surface panel solves this problem, as it shows changes in liquidity at each price level — adding new orders, changing or canceling. The brighter the level, the more orders are placed at a specific price level.
!!!
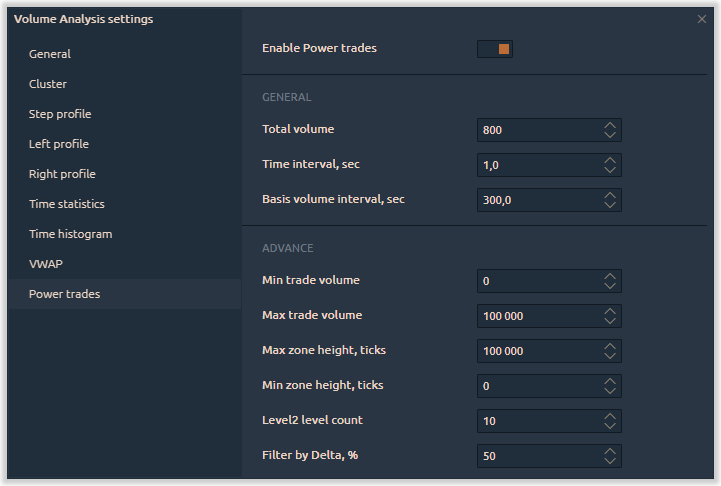
What is Power Trades Scanner?
Power Trades shows the zones with the execution of a large number of orders in a very short time. These zones are the result of a short-term "abnormal event" that is likely to affect the price change. Such an anomaly includes a short-term imbalance between aggressive buyers and aggressive sellers, which leads to price changes.
How does Power Trades find zones?
First, let's take a look at the screenshot of the 1-second chart of the E-mini S&P 500 futures. The chart shows the zone with a volume of 940 contracts, which were executed within1 second. Using Historical Time & Sales feature we can see the history of all trades that were executed within that period.
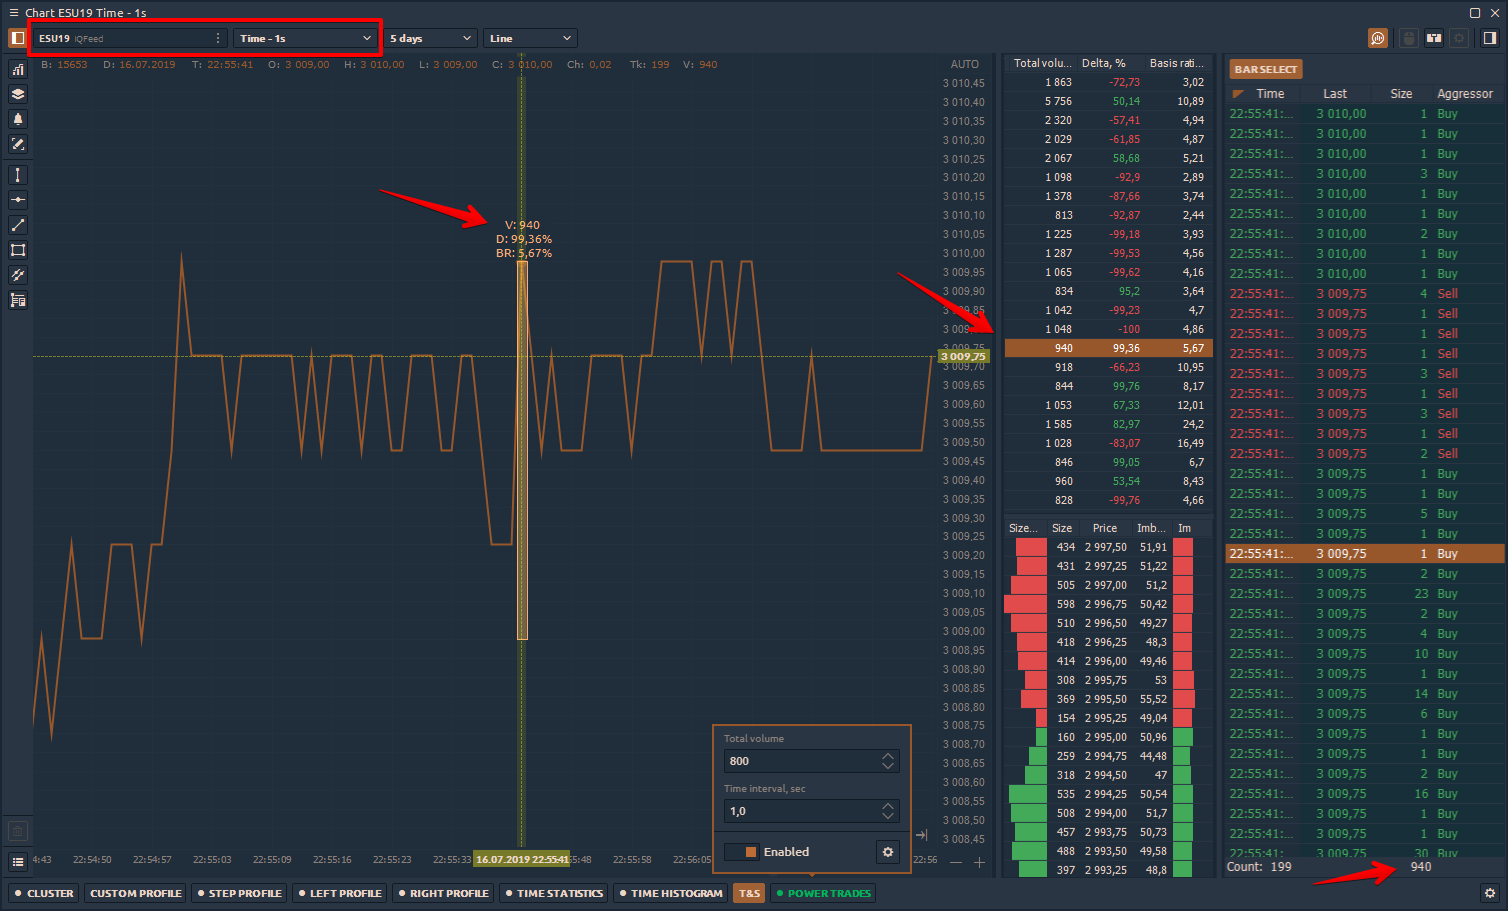
Considering that in the scanner settings we set a total volume filter higher than 800 contracts within a time interval of 1sec, the scanner found the zone and showed it on the chart. The scanner also showed the price range of the zone formation.
The appearance of the zone only indicates a significant trade interest, so the information about the volume will not be sufficient. To understand the imbalance that led to the appearance of the zone, it is necessary to take into account the values of the delta and basis ratio also.
What does the Delta value show?
Delta is a quick way to determine who is in control of the market through aggressive orders, buyers or sellers. Delta is the difference between the volume traded on the offer minus the volume traded on the bid in a particular bar or zone. Each bar (zone) will have a delta number. Delta will either positive or negative and on rare occasions, it can even be zero.
The positive value of the delta indicates the activity of aggressive buyers at the current market price. And since market buy orders are executed only on the ask/offer side through lifting (sell limit orders), a positive delta may indicate an attempt of a large participant to gain a short position through limit orders (passive filling).
The same applies to the negative delta, which indicates the activity of aggressive sellers or an attempt by a large participant to gain a long position through limit orders (passive filling).
What does the Basis ratio mean?
Basis Ratio shows the ratio of the volume in the zone to the total volume for the specified time. In our example above, the zone had the value Basis Ratio = 5.67%. It means that the volume of 940 lots occupies only 5% of the total volume for the last 5 minutes.
On the screenshot below the zone with the volume of 2246 lots, and the total volume for the last 5 minutes was 11040. Thus, the found zone has the Basis Ratio of 20.34%.
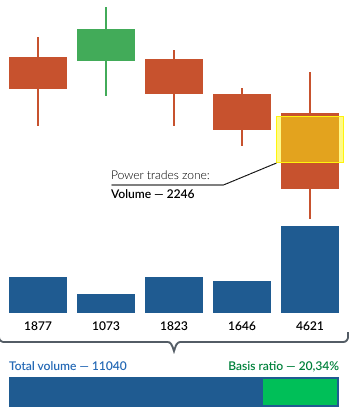
Whether this is a lot or not depends on a particular trading instrument. For ES futures, base ratio values above 10% are considered high.
Order Book Imbalance and DOM levels
After activating Power Trades, a table divided into two parts will appear on the right side of the chart. The upper part contains the results of the zones that the scanner found, and the bottom part shows two histograms in real-time: DOM Levels (left) and Imbalance (right).
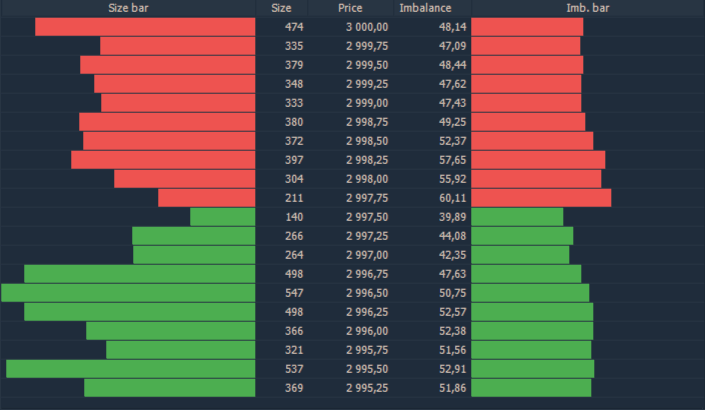
DOM is a well-known functionality that shows the current order book and its dynamics in real-time. The number of limit orders for ask and bid side is shown as a histogram with corresponding values at each price level.
The Order Book Imbalance is a ratio between the volume of limit order at bid and ask side. It measures whether the limit order book is buy or sell heavy. The more the imbalance exceeds one side, the higher the probability of price movement towards the imbalance. In fact, it is a good predictor of price direction.
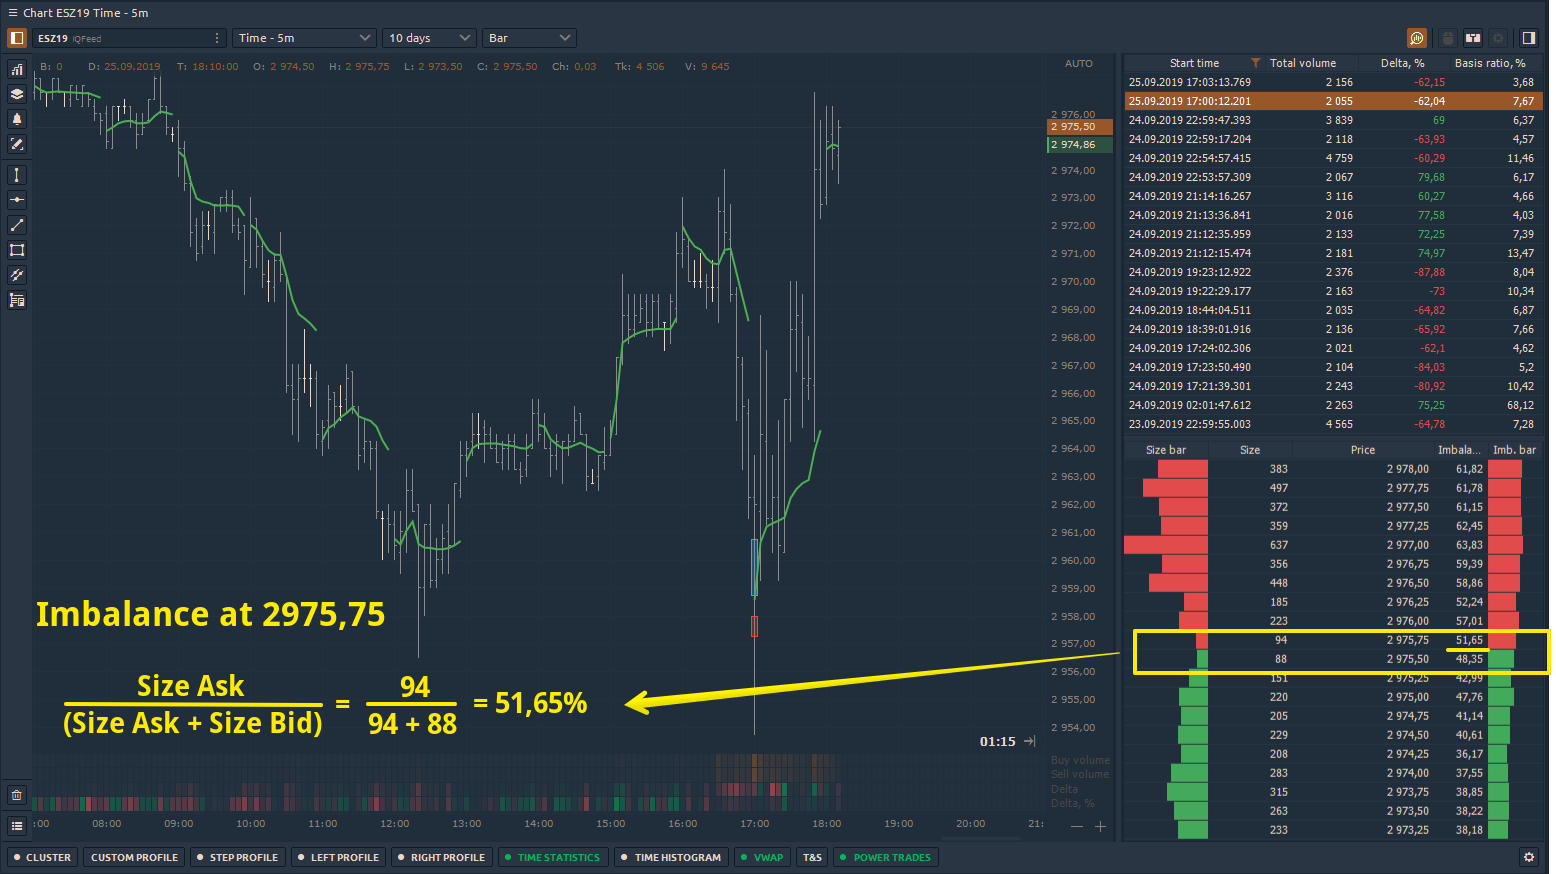
An imbalance is calculated for each price level, starting with the best bid and best offer. With an imbalance value of 50%, the market is in equilibrium, and traders agree with the current price. As soon as the supply/demand ratio changes and new orders are placed, the imbalance indicator automatically recalculates its values.
For example, on the ESZ19 futures at a price of 2975.75, the imbalance value at the 10th level is 61.8%, which indicates that the volume of sell limit orders is 12% higher than the buy limit orders. It is also necessary to pay attention to the levels with the maximum volume because they are like a "magnet" for the price. At these levels, you can place your sell orders or fix the profit.
The screenshot below shows that the price has reached the level of 2977, where previously there were 637 contracts. This does not mean that the entire volume at this level was executed. But in fact, the price tested this level, while Imbalance Level2 slightly decreased.
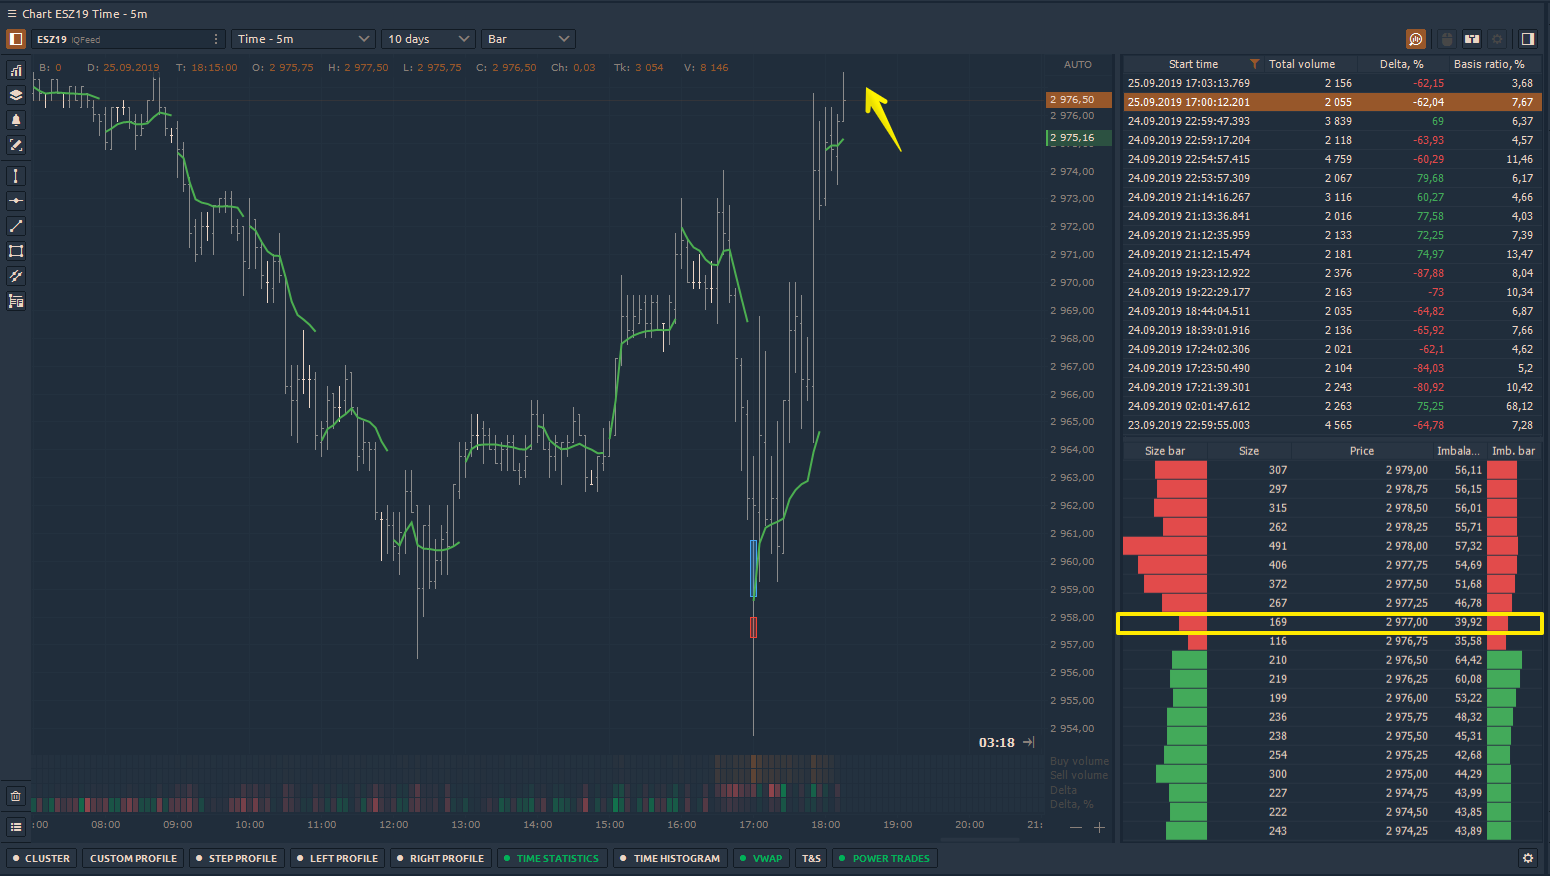
Additionally, you should look at the Cluster chart, which will show how many Buy and Sell orders were executed at each price.
How to find better trades with the Power Trades?
The settings for Power Trades should be set individually for each instrument. This is due to the difference in liquidity and trading volume, which takes place during the day.
For example, for ES futures, it is better to use two different settings for the European and American trading sessions. The screenshot below shows the difference in trading volumes for the two sessions. Therefore, settings that give good signals for one session will give many false signals for another session.
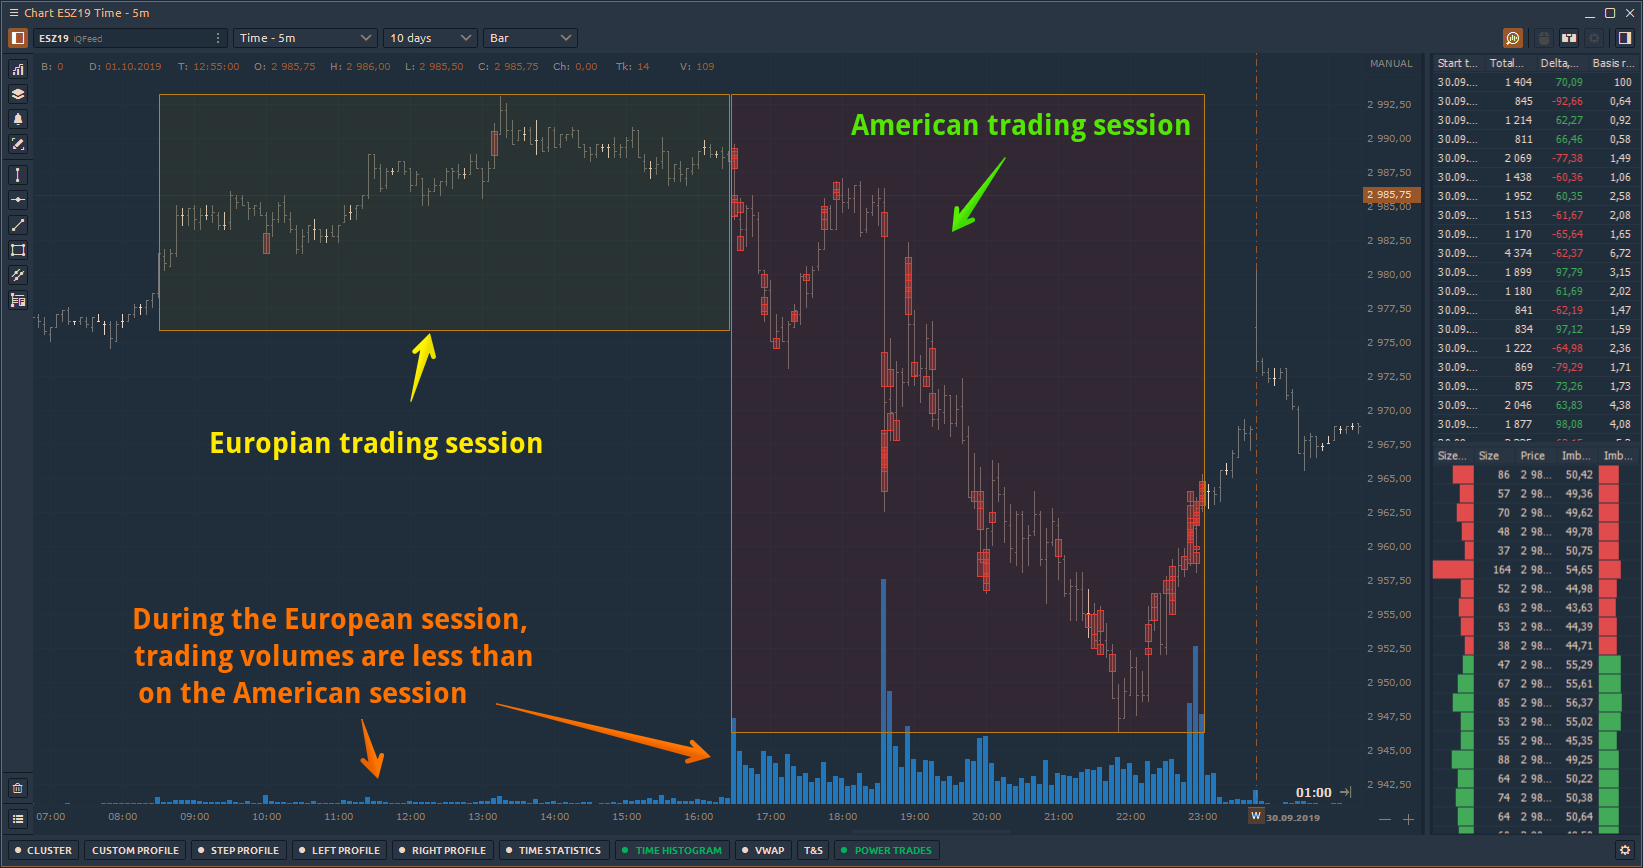
Power Trades signals should be considered in the context of the chart and other analysis tools — support and resistance levels, Price Action, VWAP, Volume Profiles.
Example #1 on ES futures
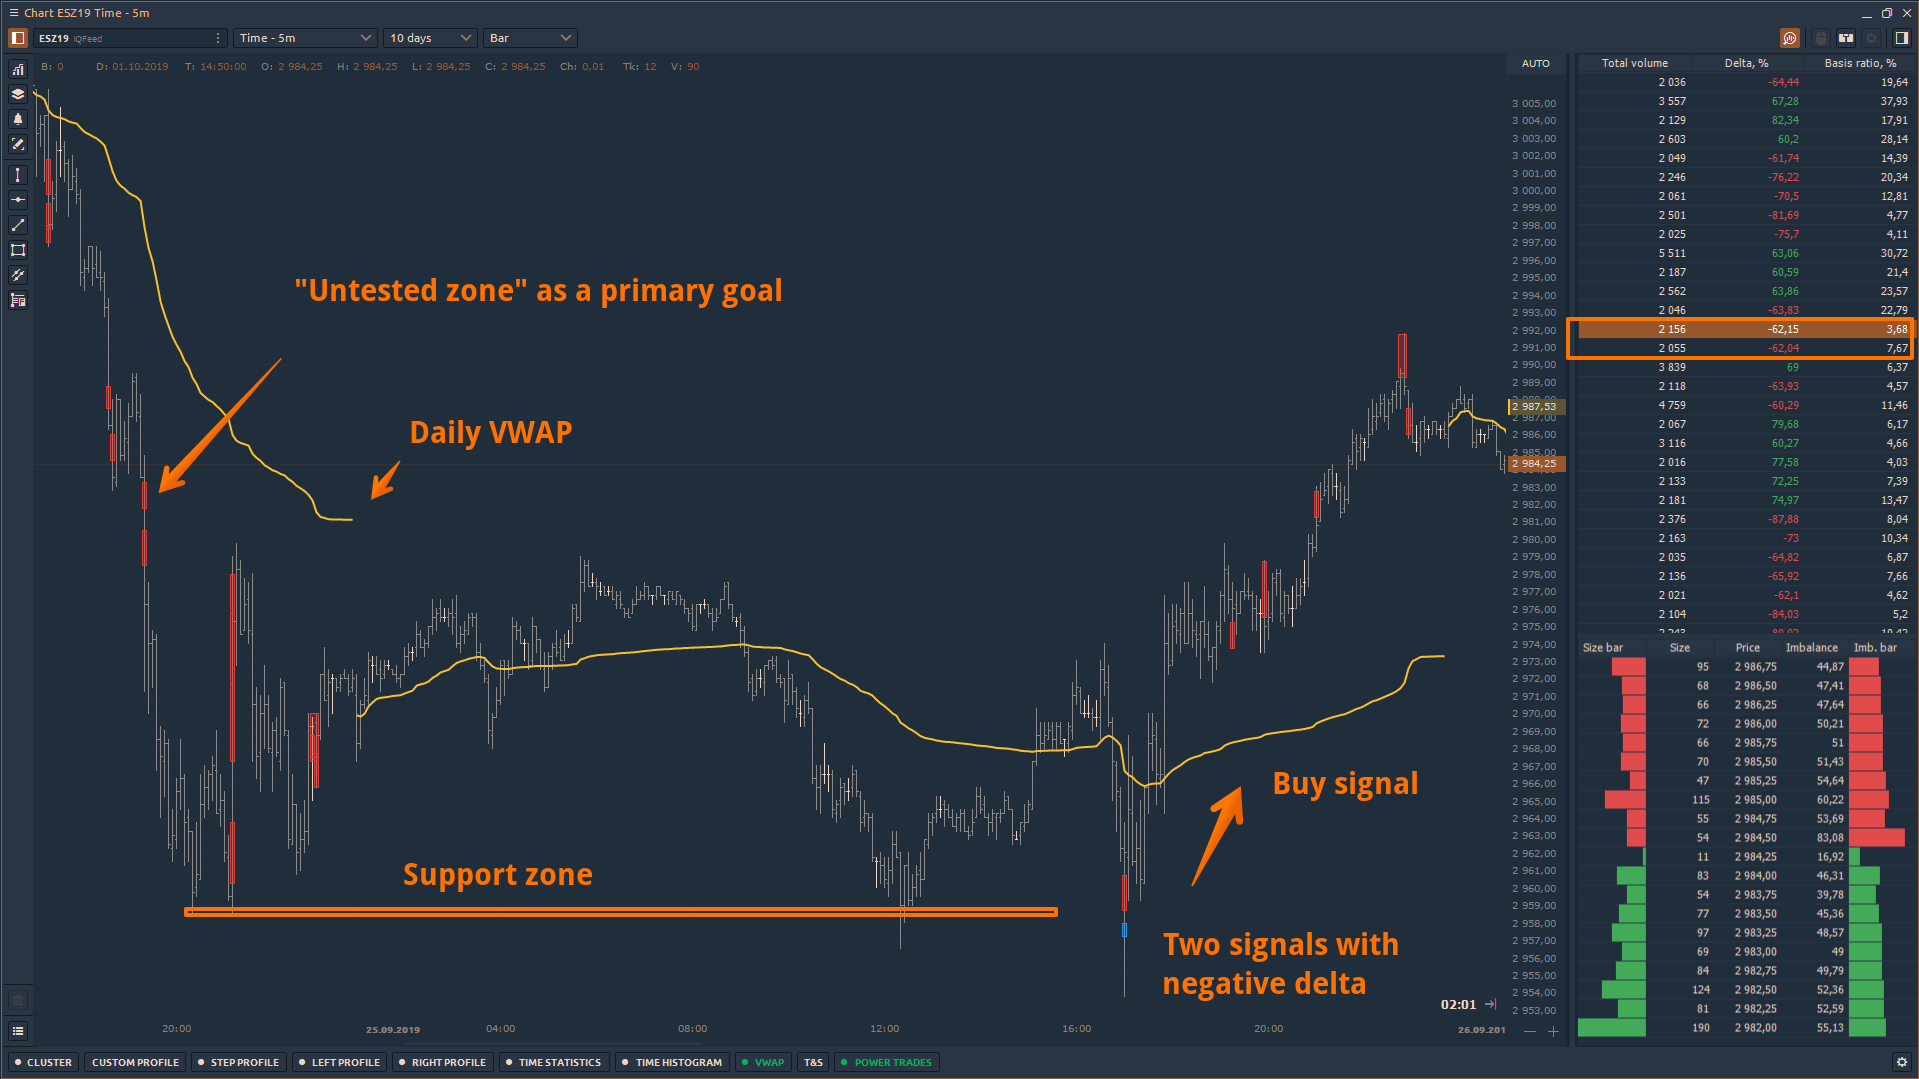
Why did we buy at this level?
- Local support zone
- Two Power Trades signals with negative delta. Settings for the filter of the scanner are 2000 lots and a delta of 60%.
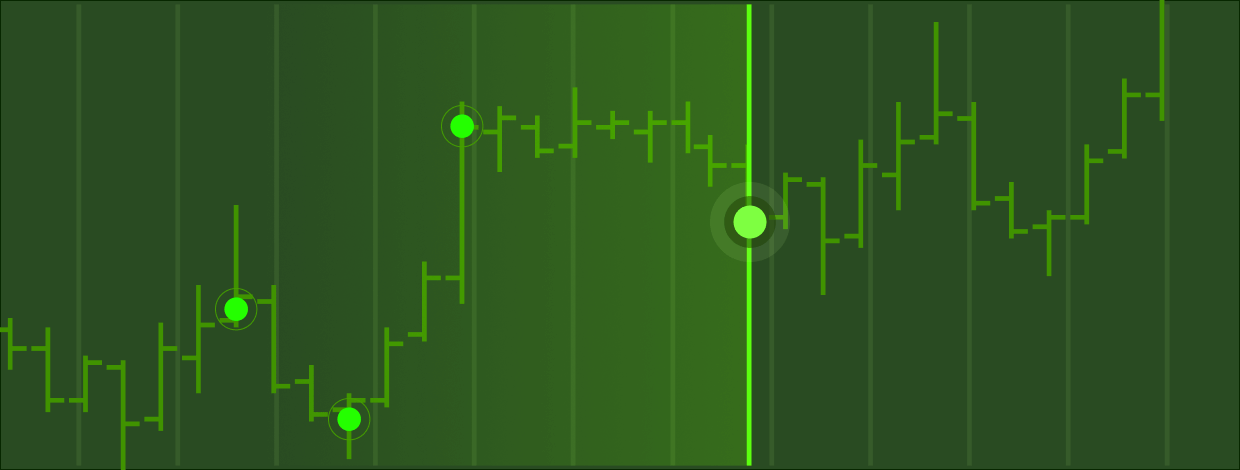
- There is a zone above that has not been tested. Such zones are always tested.
Example #2 on ES futures
At the moment of publication of important fundamental news, the market volatility increases. At this point, large traders cancel their limit orders and waiting for the results of the news. In addition, traders who already have opened positions set a stop-loss or take-profit orders. At the moment of the news release, these orders are executed and as a result, Power Trades signal will appear.
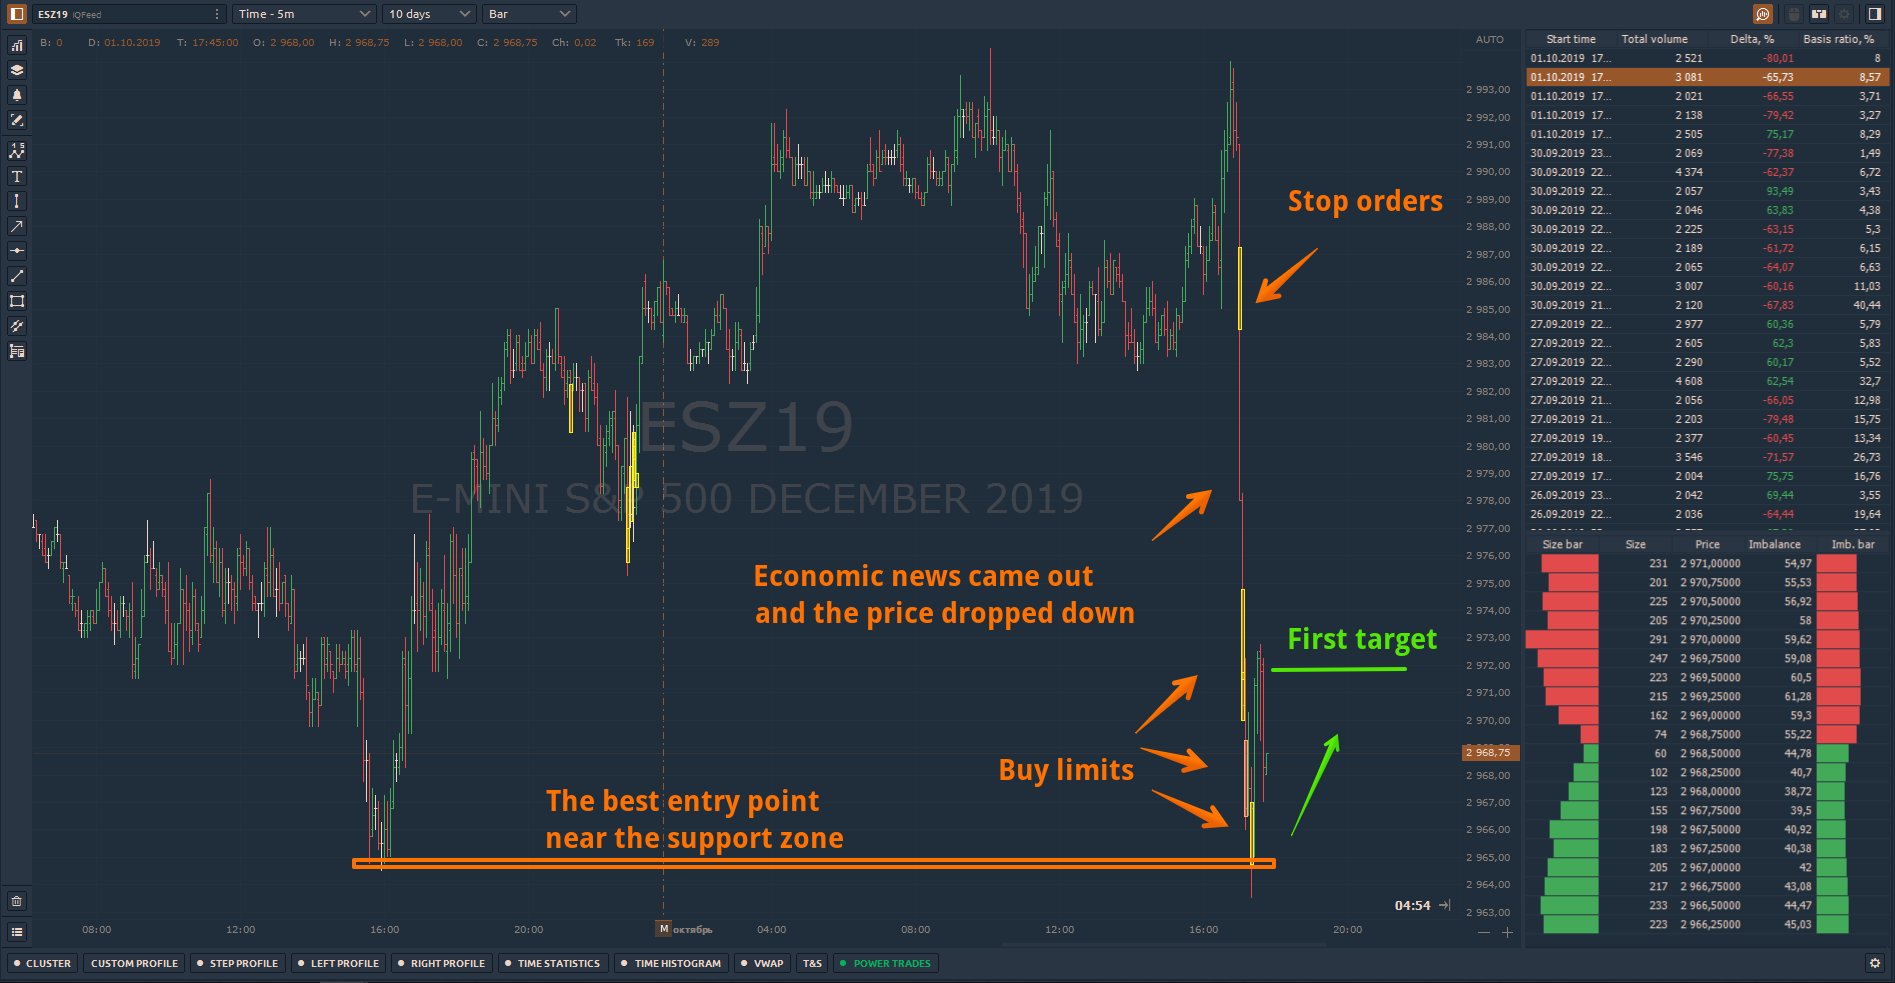
As you can see in the screenshot above when the news came out, the price fell significantly, and as a result, there were several Power Trades zones.
The best entry point will be from the strong support levels with the first target to the nearest zones.
English
Trade with Quantower
Download the latest stable version of Quantower application for Windows for free and without registration
Comments