DOM Surface panel for deep Order Flow analysis
Navigation
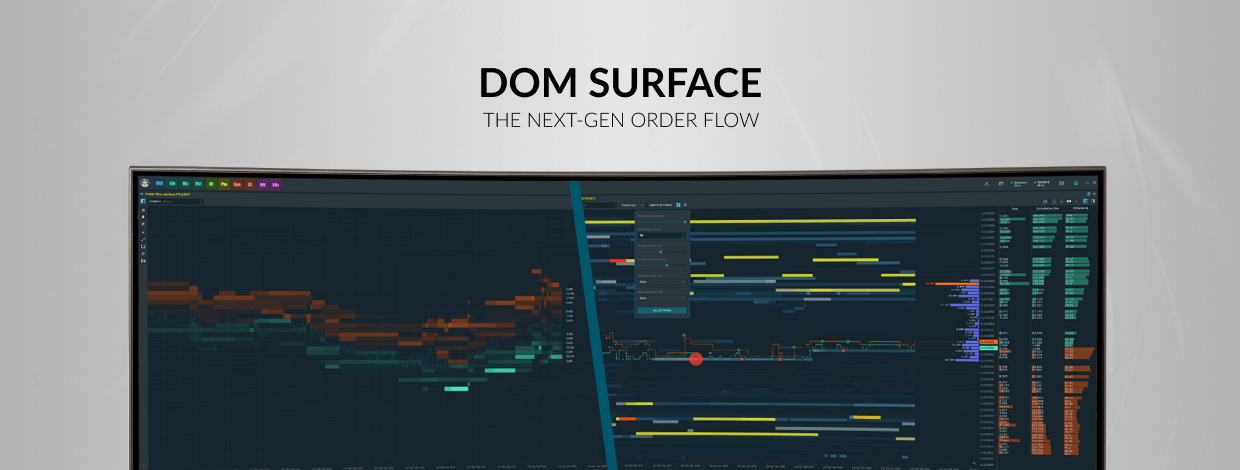
The first and main news of this release is the new DOM Surface panel. Connecting to Coinbase Pro, a new charting style and alerts for indicators are ready for use in the Quantower platform
DOM Surface Panel — a brand new view on order flow analysis
The liquidity analysis in the Order Book gives a key to understanding the market and allows you to see patterns and levels from which the price can bounce back with a high probability. It shows all changes and evolution in limit orders in the form of a map. But we went further :)
Today we are pleased to present DOM Surface — a new and improved tool for professional analysis of order flow. So, let's see what's interesting in it:
- Added three coloring modes to visualize the liquidity map — Monochrome, Bichrome, Heatmap.
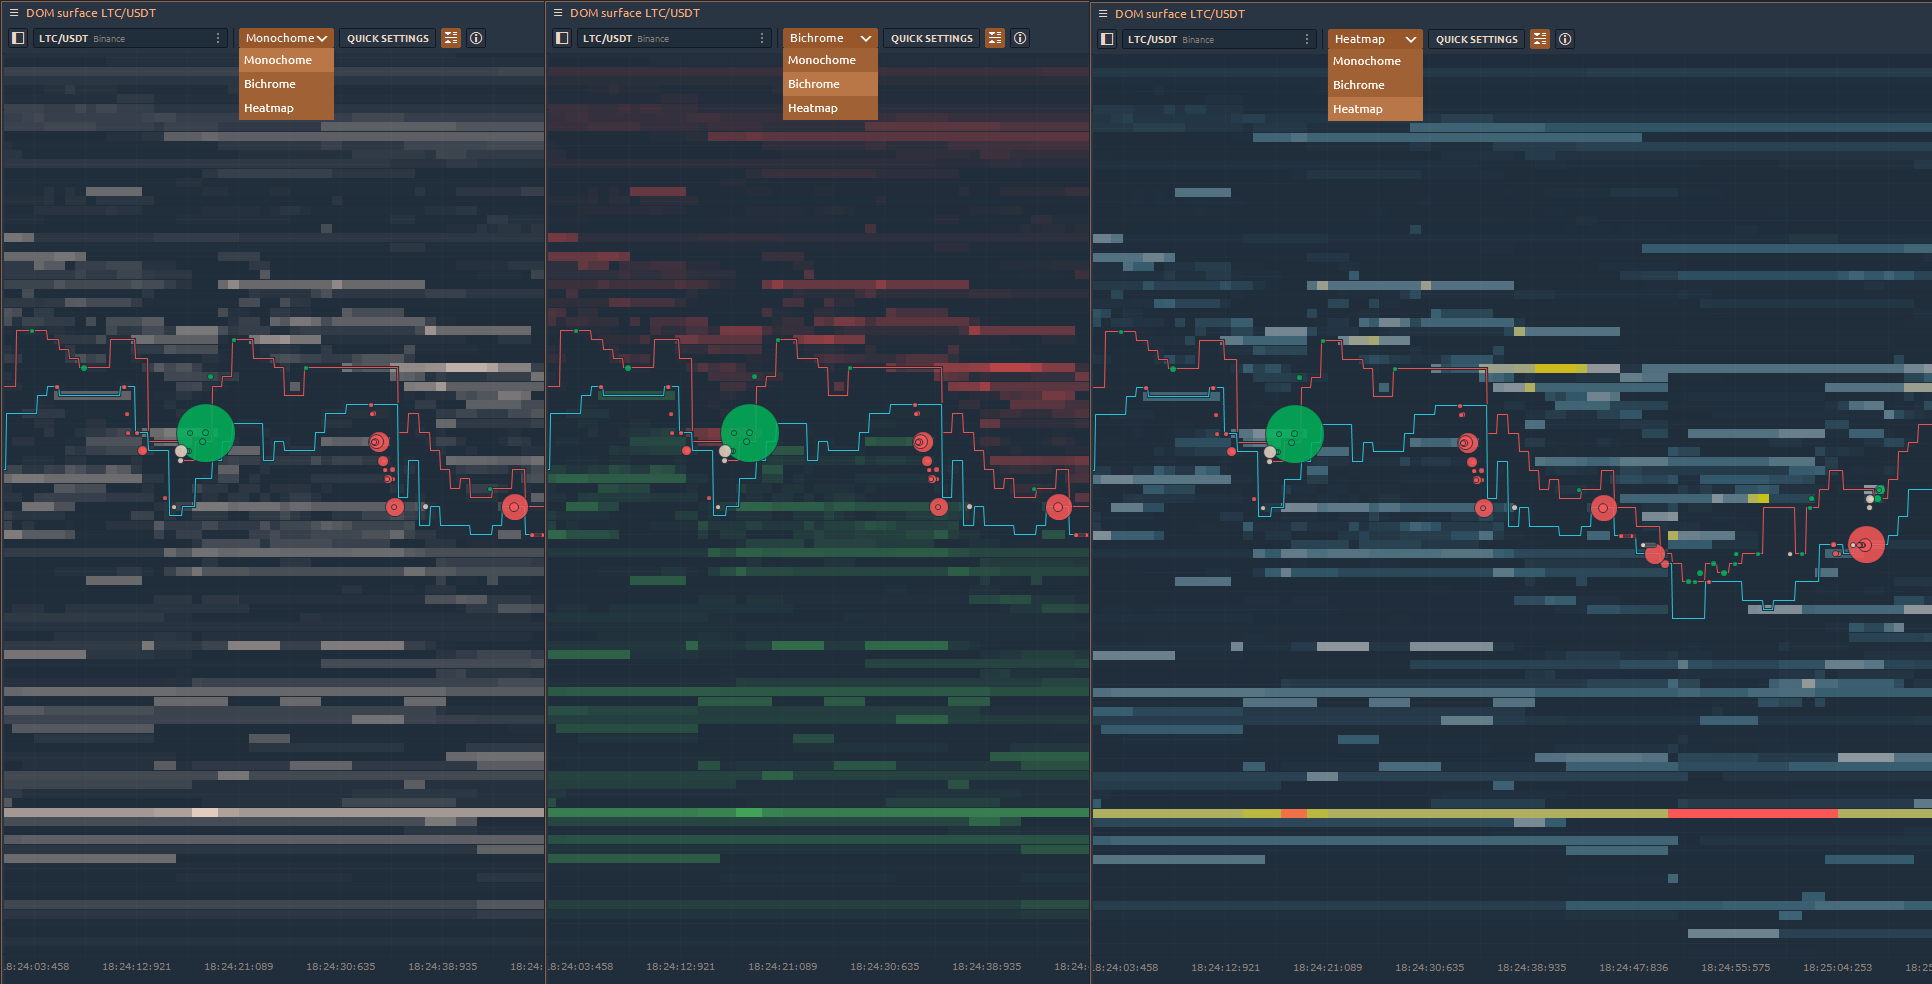
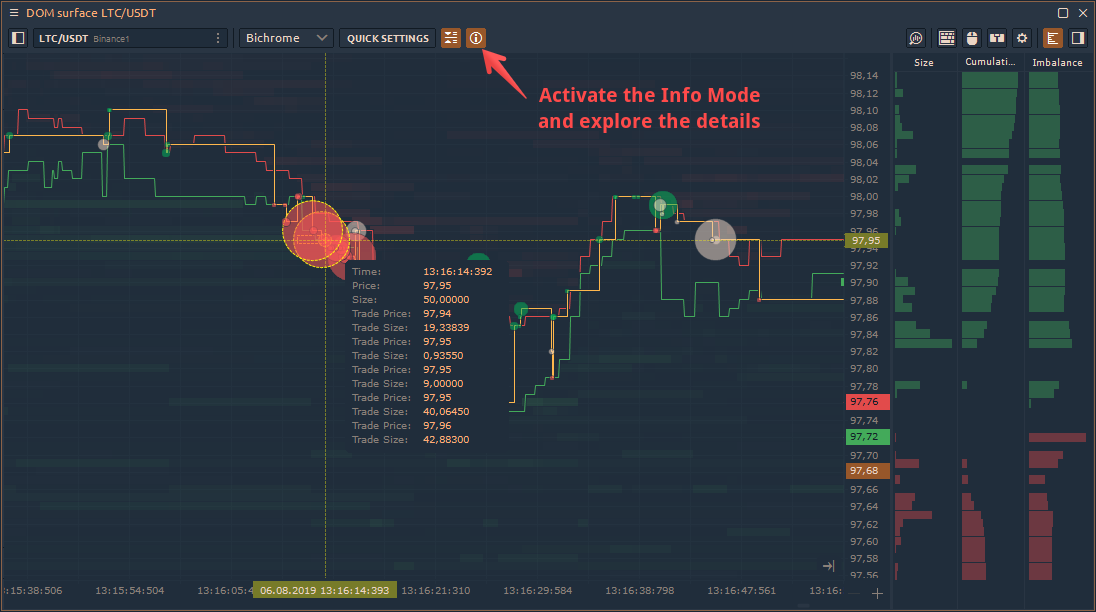
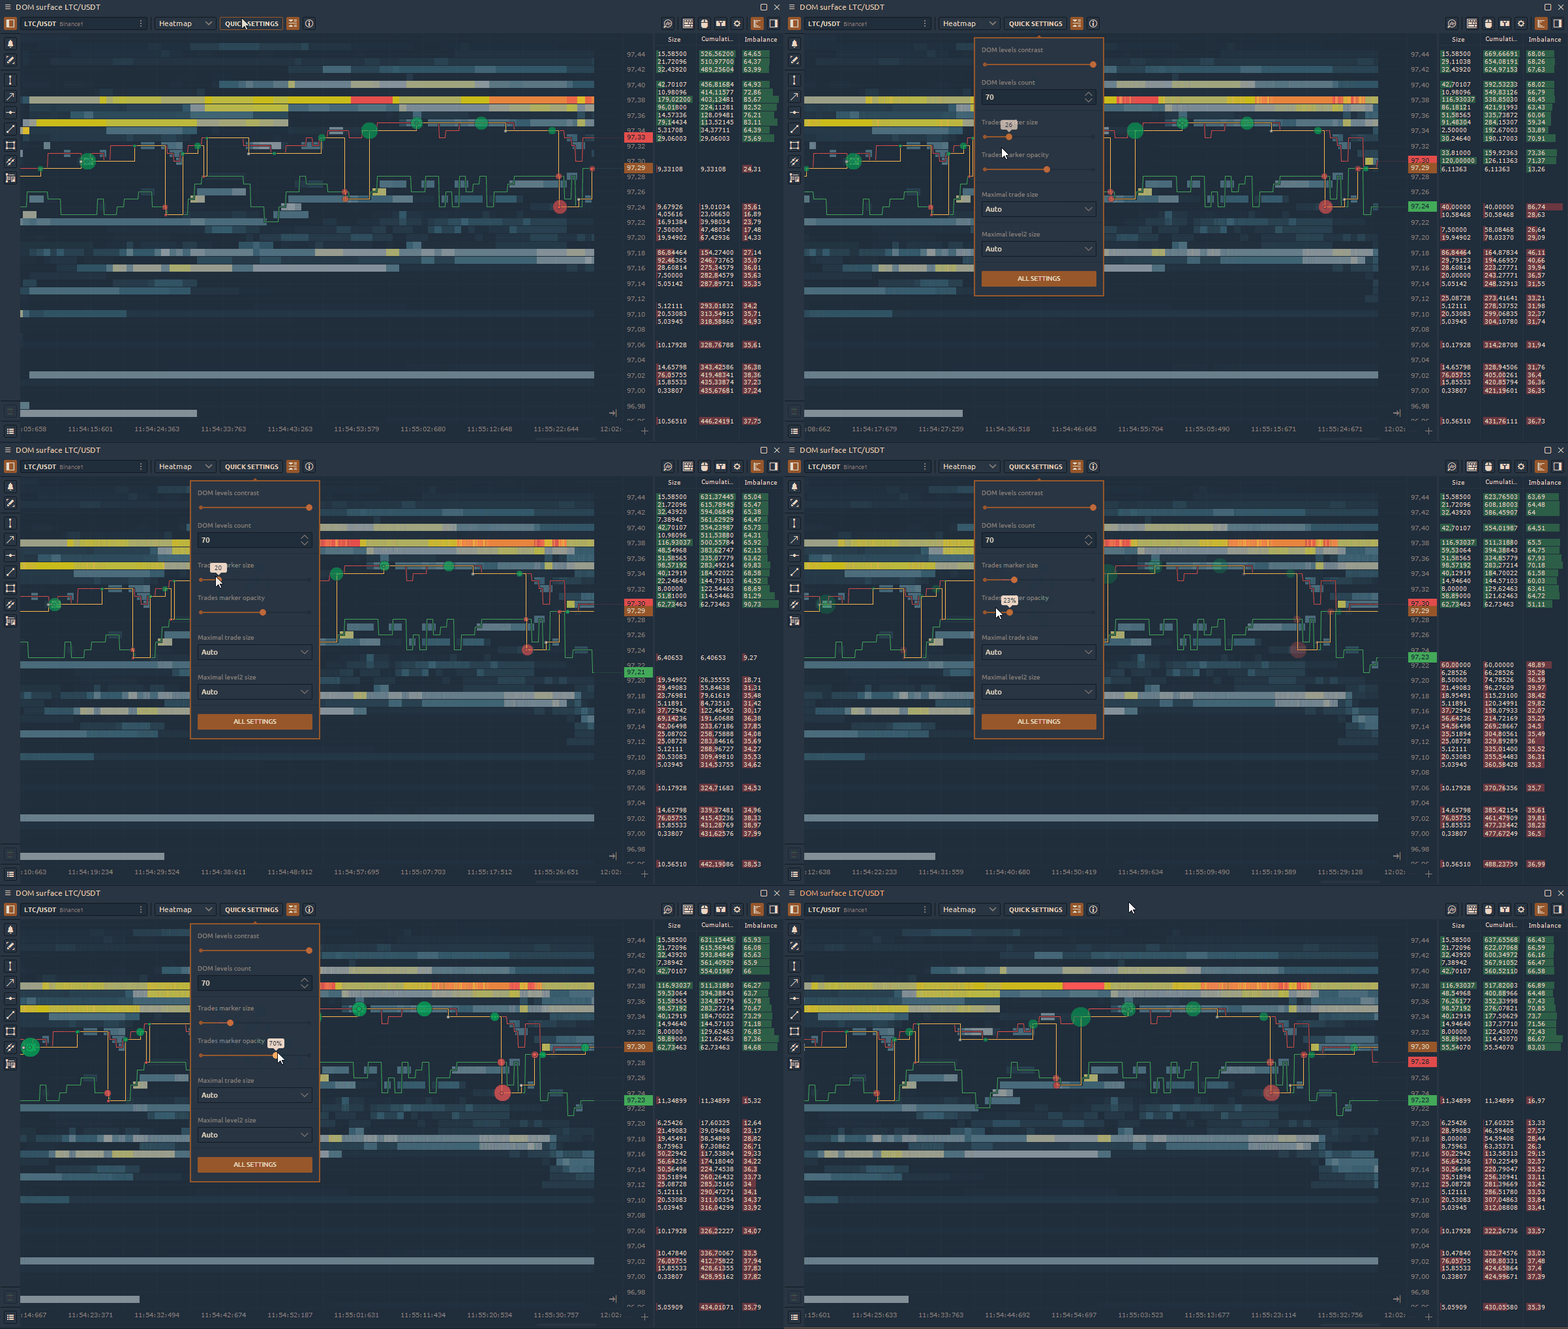
- The execution of market orders is shown in the form of Circles. Red circles indicate the execution of sell orders, and green circles indicate the execution of buy. The size of the circle corresponds to the order volume. In the settings of the panel, you can set the maximum size of the circle, its opacity, as well as the maximum trade size.
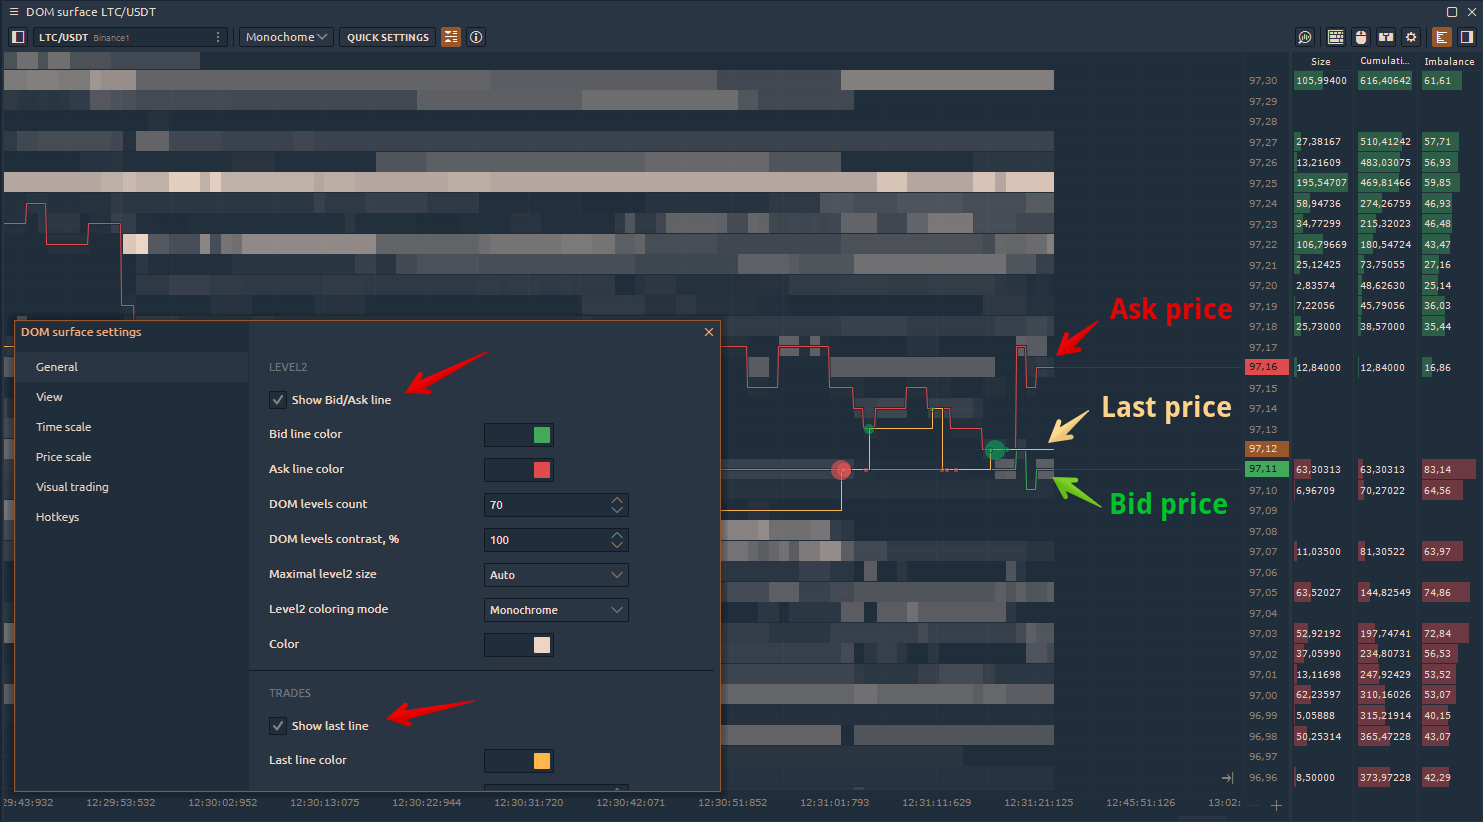
- In addition to the Last Trade line, you can include Bid/Ask lines on the chart. For each line, you can set any color for a better perception.
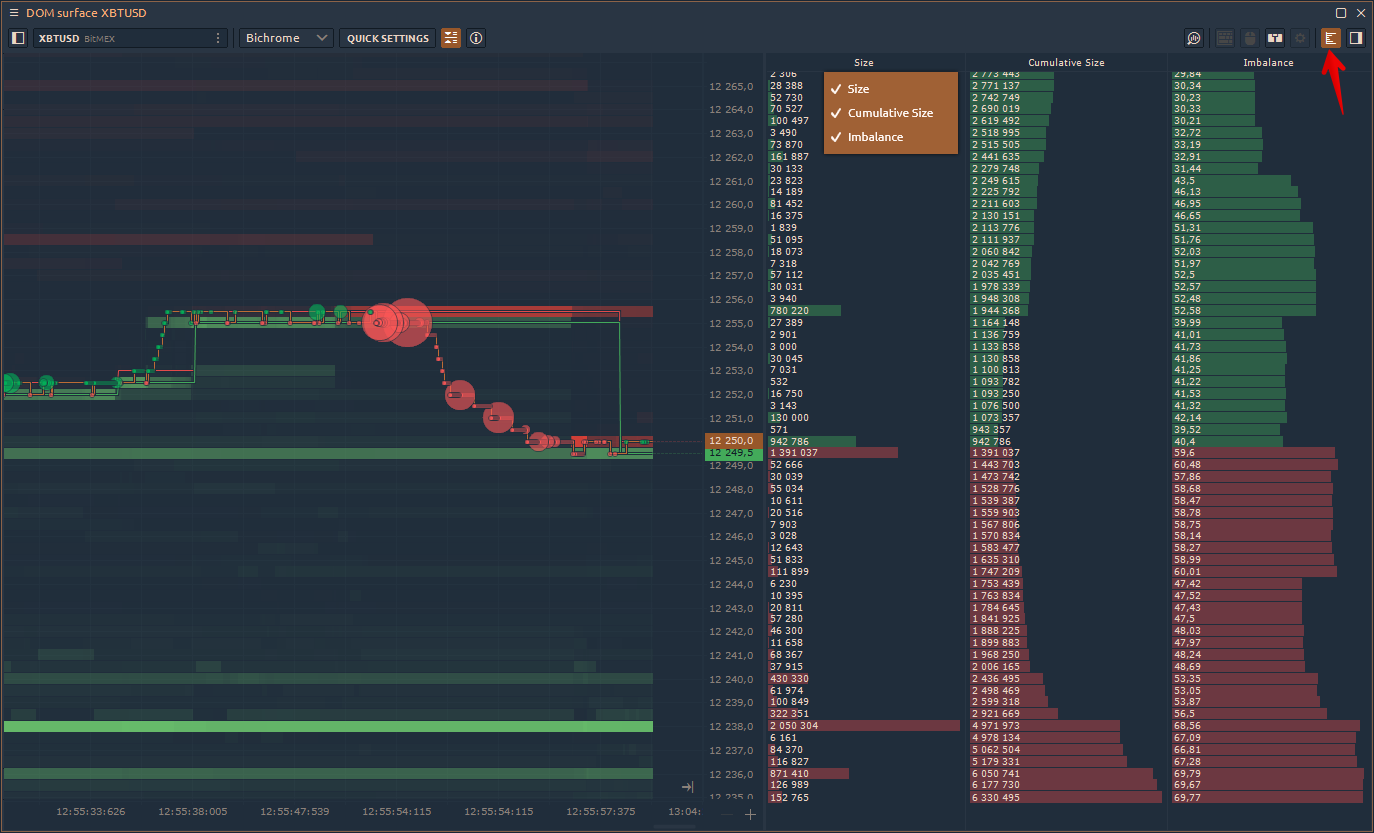
- On the right side of the panel, there are three histograms — Size, Cumulative Size, Order Book Imbalance.
Size shows the volume of limit orders at each price.
Cumulative Size shows the sum of Limit order volumes for each subsequent level. This histogram allows estimating the dominating side of the market.
Imbalance shows how many percents of buyers are more than sellers (and vice versa) for each price level.
- When you move the cursor over the map area, information on the level and volume at each price will be displayed in the upper left corner. By activating the info mode, you can hover over any circle and see the actual size of the executed order.
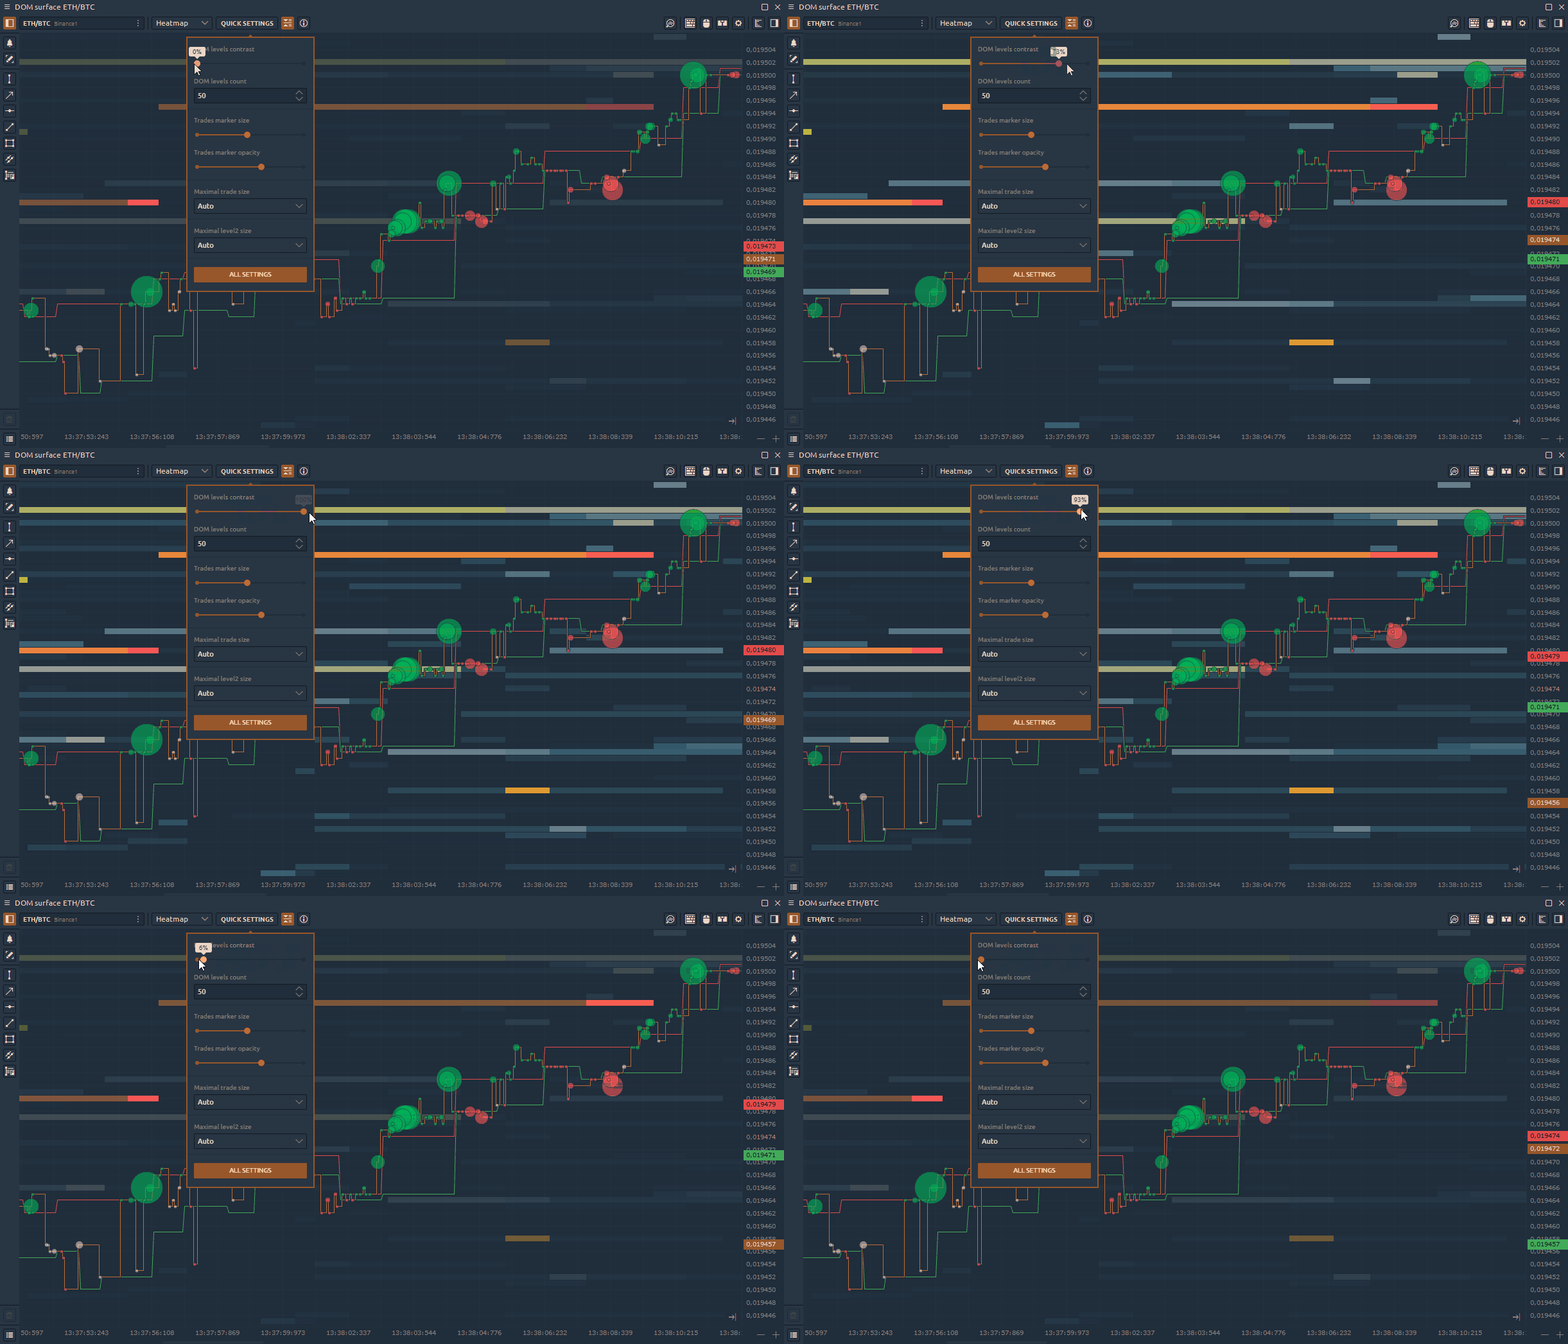
- The main bar of the panel has quick settings where you can set the required number of DOM levels, as well as their contrast. This allows you to focus on levels with high liquidity.
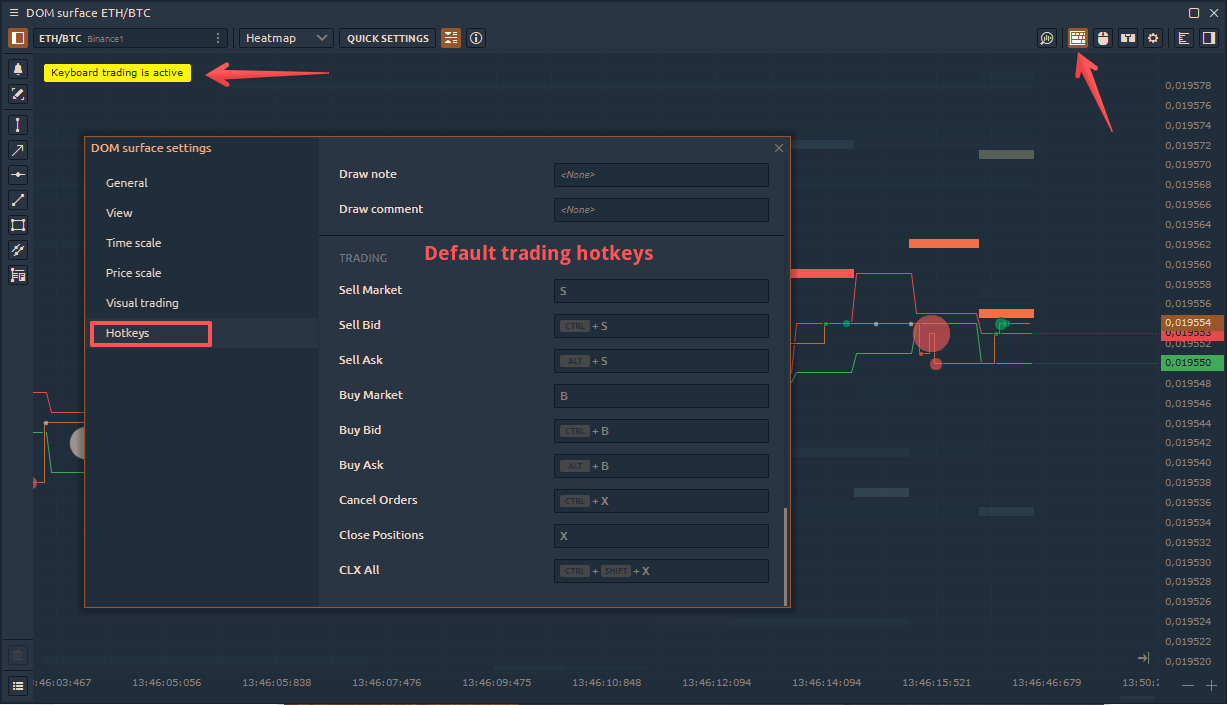
- Added 9 Hot Keys to perform basic trading operations: placing market orders, placing limit orders by the best bid/offer price, canceling orders and closing positions. This is by far great addition which allows you to quickly respond to changing market conditions.
- We have added an auto-centering of the chart, which aligns the price position in case the bid/ask lines go beyond the chart visibility.
Coinbase Pro (GDAX) is available for charting & analytics
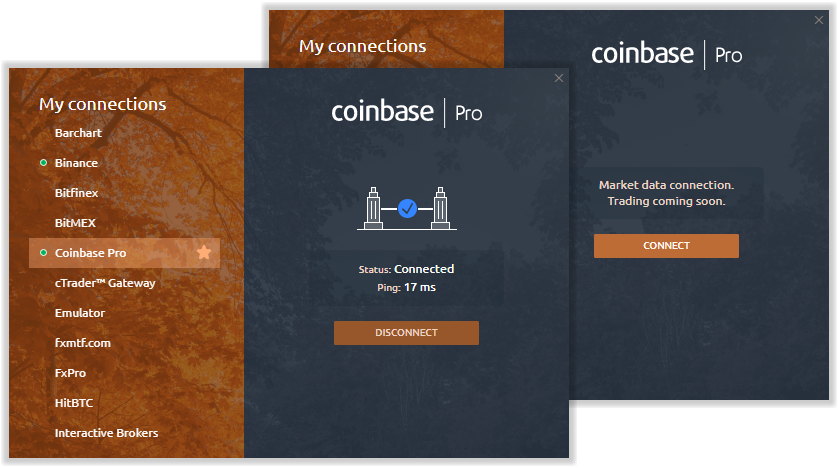
We continue to expand the list of connections in the platform. Today we are pleased to introduce Coinbase Pro known as GDAX in market data mode. This mode allows you to analyze all available cryptocurrencies without using the API Key or any login data.
Quantower Chart Style
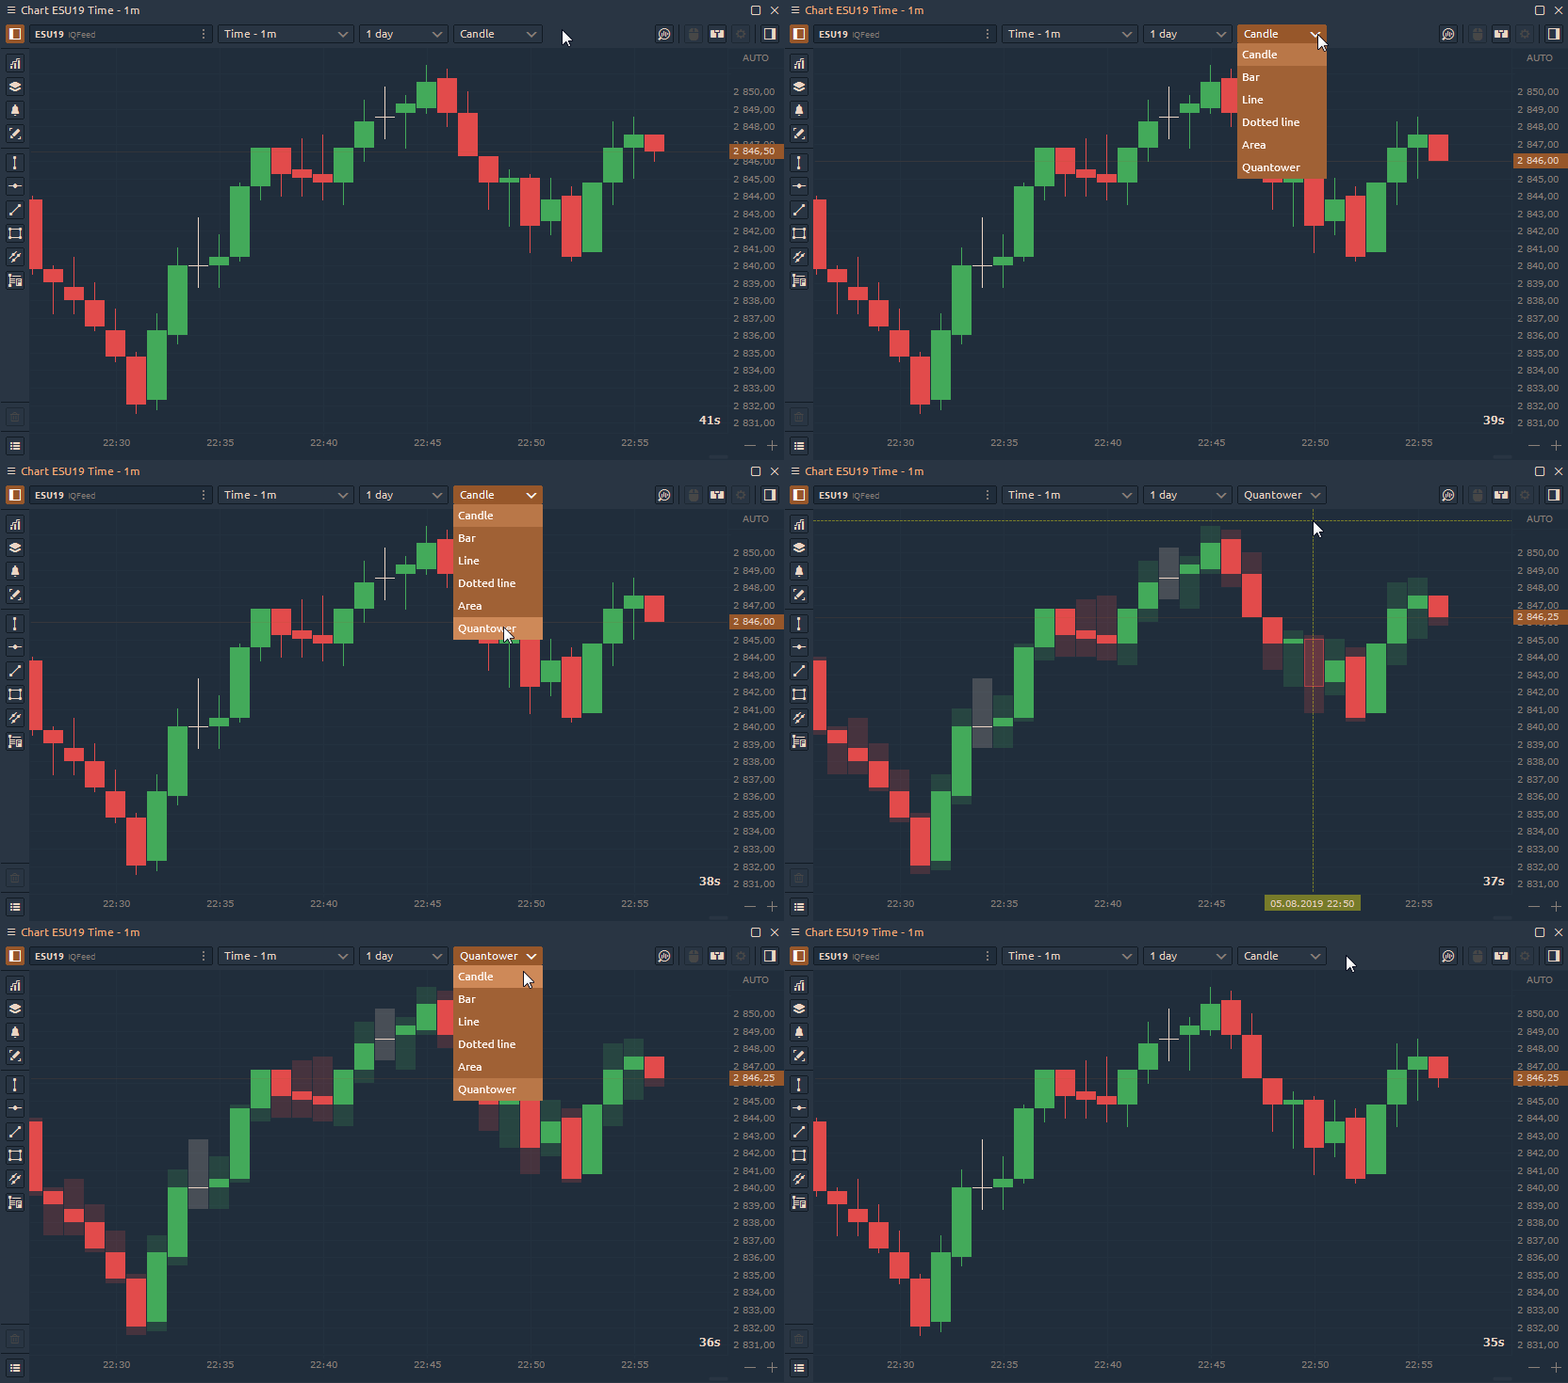
We made small visual changes on the well-known candle chart — shadows of the candles have the same thickness of the candle itself and added transparency to them. This chart style we called "Quantower" and you can choose it from a list of chart styles.
Alerts for Indicators
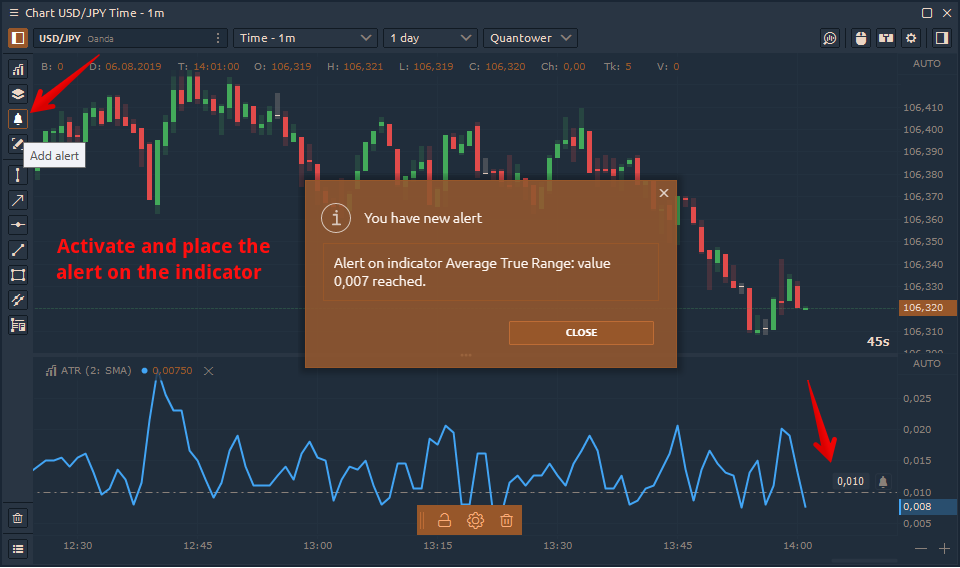
At the user's request, we added alerts for indicators. After setting an alert on the necessary indicator, it will be active until the specified condition is met. Alert placement is performed in the same way as on the main chart, i.e. through the "Bell" icon
And that's where I have to say goodbye, but not for long. We have more other news coming your way very soon, so keep your eyes open!
By the way, speaking of the updates. To get the new version, click on the "Logo" icon and open the sidebar, then press the “NEW VERSION” button at the bottom and get on About screen. Press the "DOWNLOAD" button, and Quantower will download the latest version and prepare it for the update.


Comments