What is Volume price analysis and how can it help in your trading?
Navigation
In a nutshell, volume analysis is a powerful trading technique that allows you to look deeply into market structure and grasp processes that move a price.
In an efficient market, which are all modern stocks and futures markets, the price is always fair and already has included all events that were happened for the current moment.
Inefficient or weakly efficient markets, like crypto-assets, allow you to use more simple techniques that are based on technical analysis or price action. But anyway all of them tend to become efficient.
Thus, an understanding of the imbalance between supply and demand can serve as a fundamental factor in making better trading decisions.
Accumulation and Distribution — Two main market phases
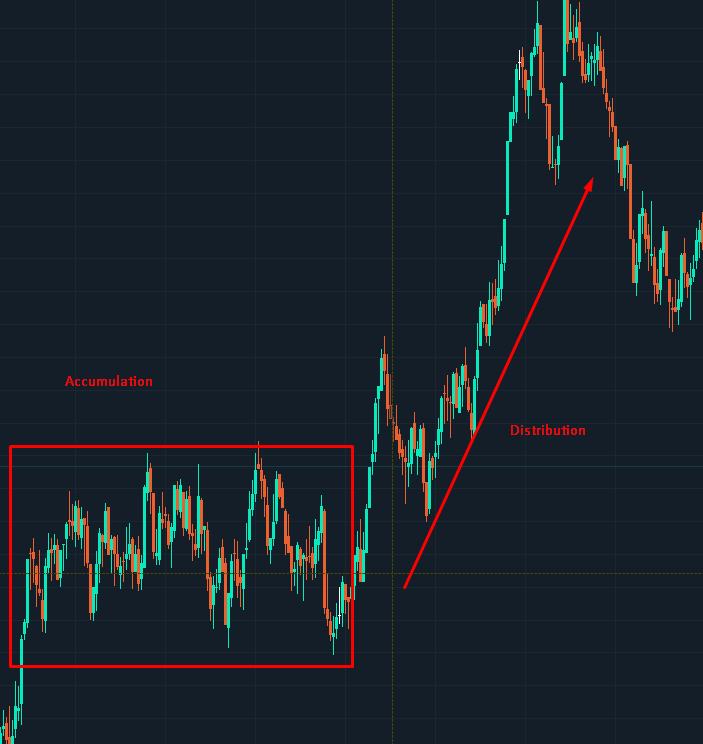
Structure of any financial or commodity market has a cycling nature, in which we can distinguish two important phases alternately passing into each other:
- Accumulation phase
- Distribution phase
During the Accumulation phase market participants entering their positions within a particular time (from several hours to several days) that eventually turns the “balance” state into a state of “imbalance.”
In the market structure, one of the sides begins to predominate: buyers or sellers. This process has a spontaneous nature and its duration in time is always different, but the result of this process is always the same - the transition to the distribution stage.
Distribution phase is characterized by a rapid price change, because at the moment, one of the parties (buyers or sellers) strongly dominates the market, pushing the price. In fact, the distribution stage is the search for a fair price where buyers and sellers will be in a state of balance again.
At the same time, the distribution stage does not always come from the accumulation stage. The key trigger can be any economic or financial news like interest rate change, export/import balance change, etc. All that somehow affects the traders’ decisions, sometimes significantly in form of imbalance. Power Trades tool can catch such events.
For example, a yearly report of grain harvest directly affects the value of the corresponding grain futures. The report on the change in natural gas reserves accordingly affects gas futures and so on.
Volume, the core element of market structure
It's no secret that the price change is depending on a change in the supply-demand ratio. If buyers dominate the market, then the price moves up and vice versa.
If you take a closer look at the trading process, you will notice that the traded volume is moving the price at a given moment in time. For example, if we send a Market Order to buy 10 lots of an asset, and the nearest opposite Sell Limit order has a volume of 1 lot, then we will buy it and redeem the next level after it, and then the next, and so on until the entire order in 10 lots will be executed. Thus, we have created an upward price movement using our market order.
Such a struggle between buyers and sellers constantly occurs within the accumulation stage. Therefore, it is critically important for us to understand what levels at this stage have taken place. Fortunately, we can easily identify levels on which, was accumulated the largest volume.
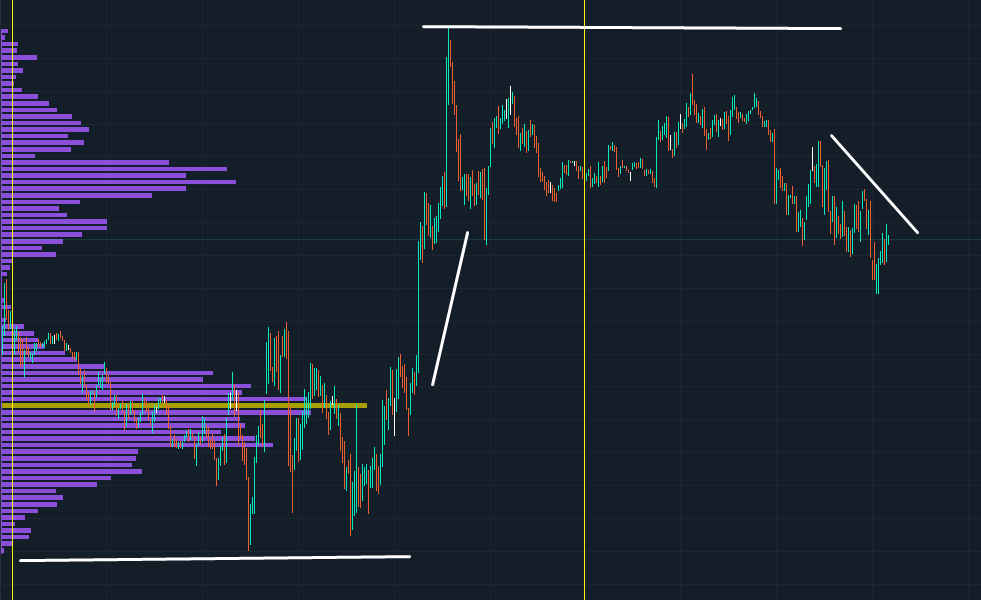
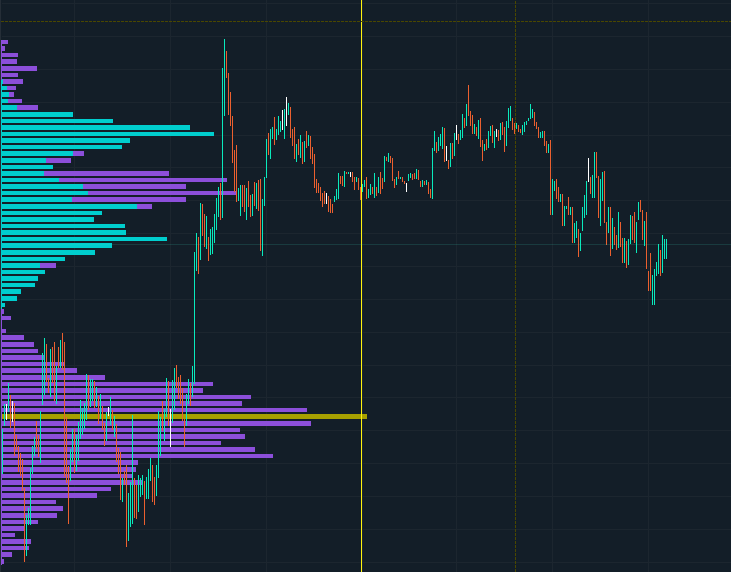
Let's take a look at the screenshot below that illustrates a volume profile for the one previous trading day. We see two accumulation zones and two small distribution stages.
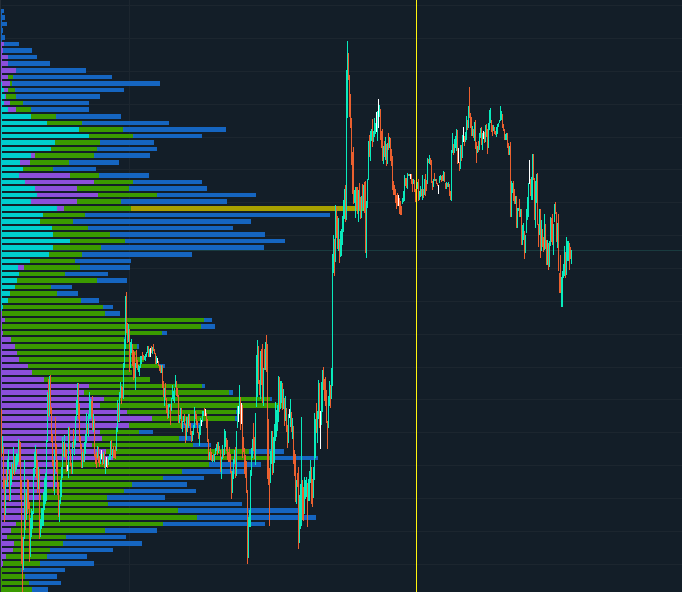
Let's add more details in our example using a current day’s volume profile as an overlay.
The blue histogram of volumes for the current day is distributed by a dense group at the same levels as yesterday, continuing to form a stage of accumulation in a fairly narrow price corridor.
Let's add volume profiles for the current and last weeks.
The dark blue histogram is the volume profile for the last week, the green for the current one. Based on the presented structure, it can be concluded, that the current stage of accumulation is a part of the accumulation stage, that was formed last week.
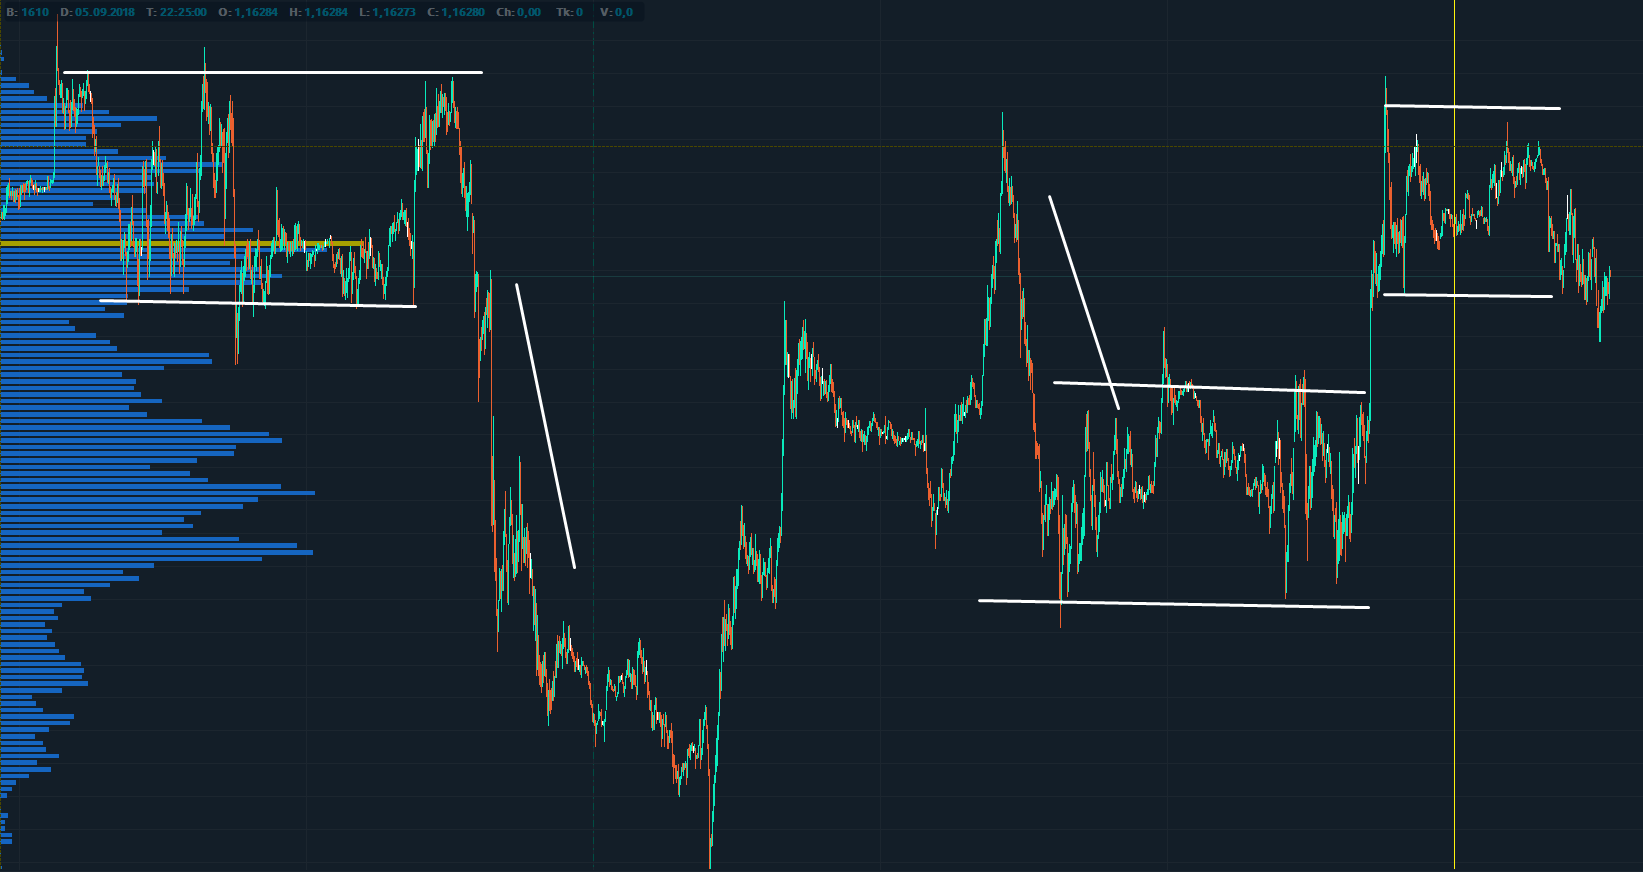
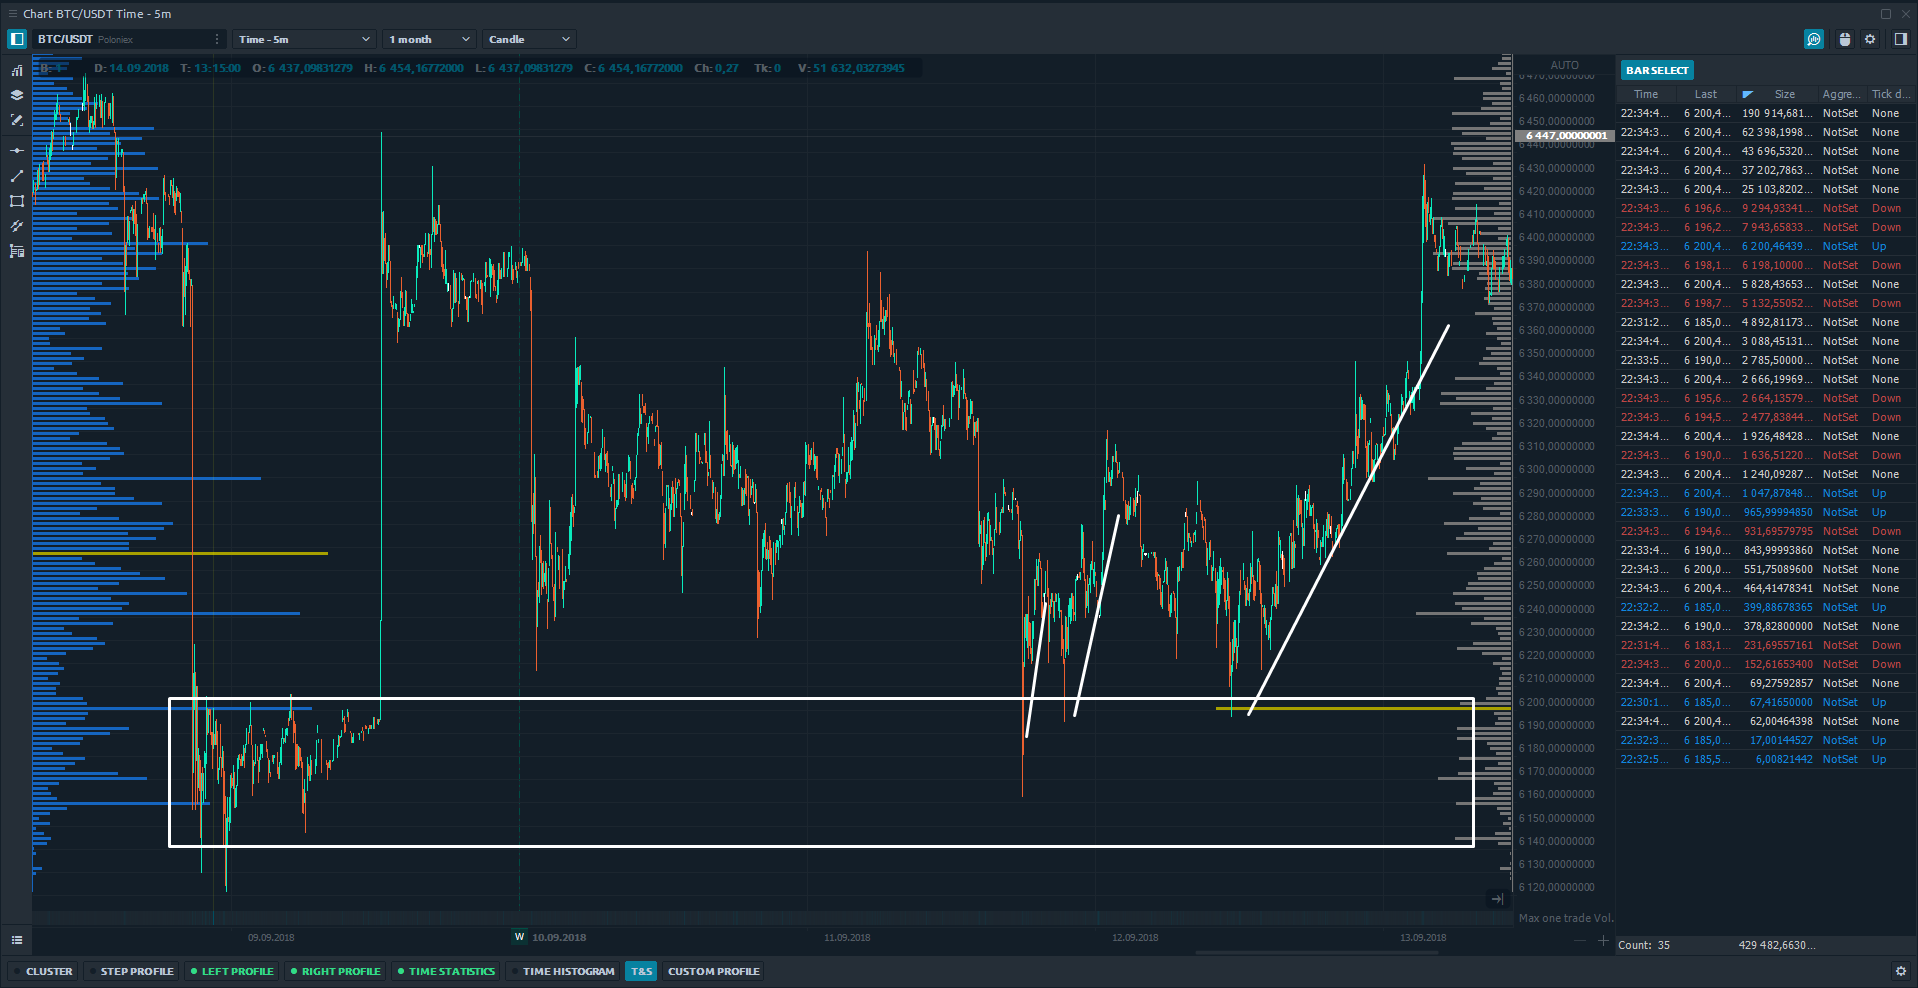
Let's see how the price reacted to the volume, accumulated during the last week.
We see how the asset’s accumulated volume was distributed downward by the trend, after which it returned to the same zone, and then was distributed downward again, after which a new accumulation stage took place. Then was a small distribution and again the accumulation stage in the zone of volumes formed last week.
Conclusion: the accumulation stages are strong resistance/support zones, and the combination of such zones for different time intervals increases their significance and reliability further.
The analysis of volume profiles gives you an understanding of the relationship between the structure of supply and demand and allows you to conclude who is currently owning the situation and on what areas the price can react in the future.
The set of Volume analysis metrics - Delta, Number of trades
As have already been described previously, volume - is a fundamental factor affecting the price, but along with it, there is a wide variety of metrics, the combination of which allows more detailed understanding of the causal relationship of the ongoing process.
Let's look at some of them. The first metric that should be paid attention to is the number of trades. The combination of the distribution of trades and volumes allows you to make interesting conclusions.
A large volume, along with a large number of trades, indicates the interest of traders in this particular level, this level will be the mathematical expectation around which the accumulation zone will be formed, in other words, it will be the center of the channel from which the trend movement will subsequently go.
But also it should be understood, that such level is most likely will not be a specific starting point for the trend.
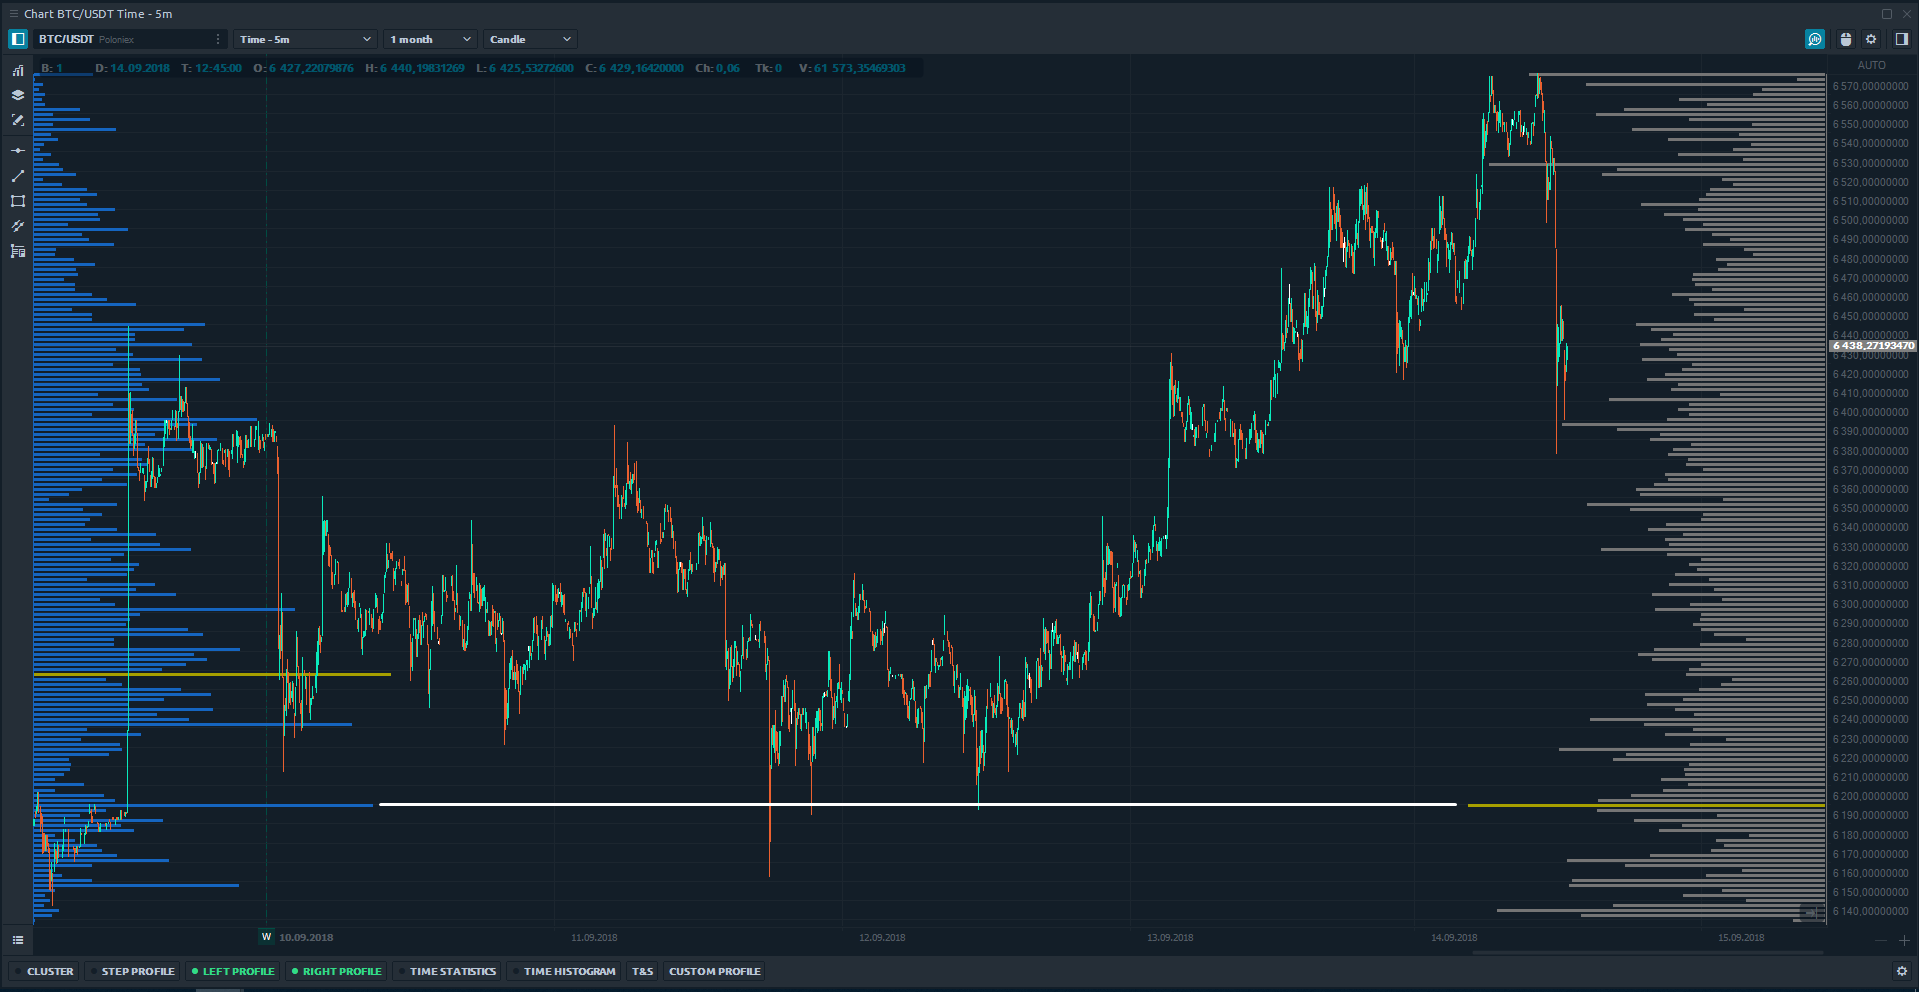
However, a large volume in conjunction with a small number of trades can show the presence of large traders and such an accurate level or group of levels can be excellent resistance/support zones.
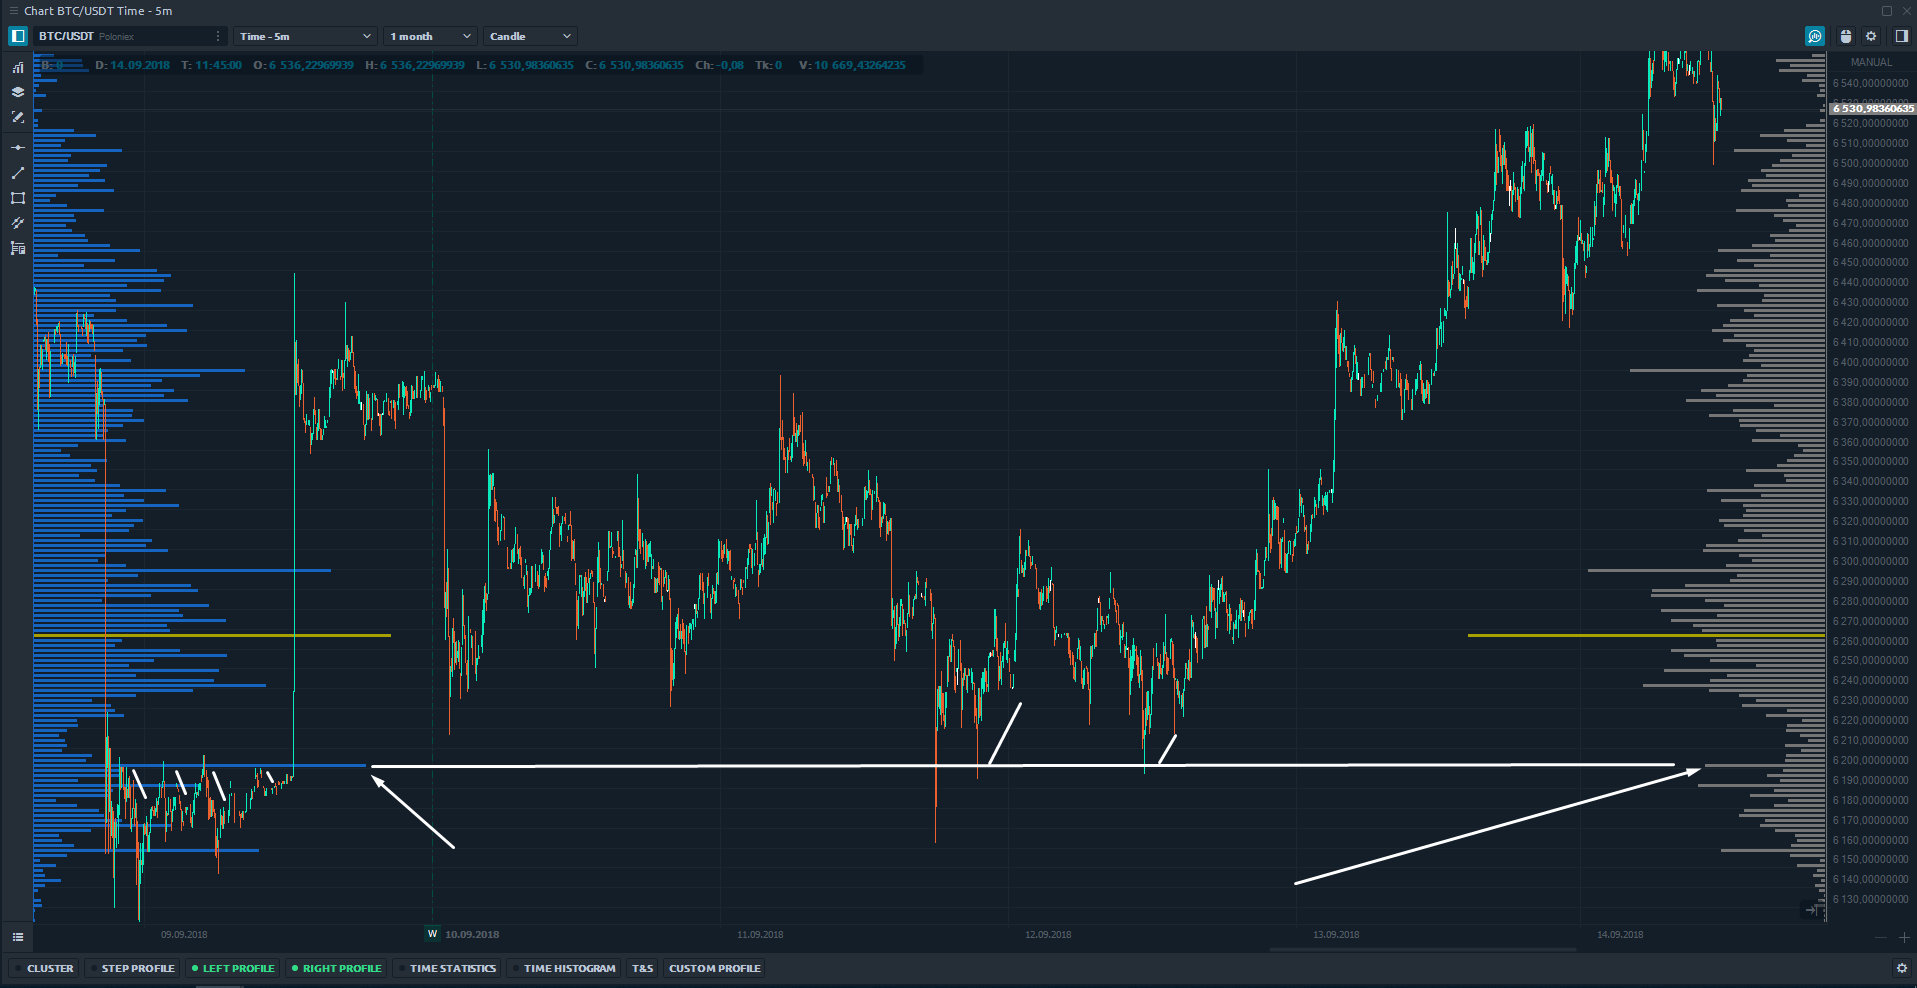
On the screenshot, the blue histogram is the volume distribution for the week, and the gray histogram is the distribution of trades.
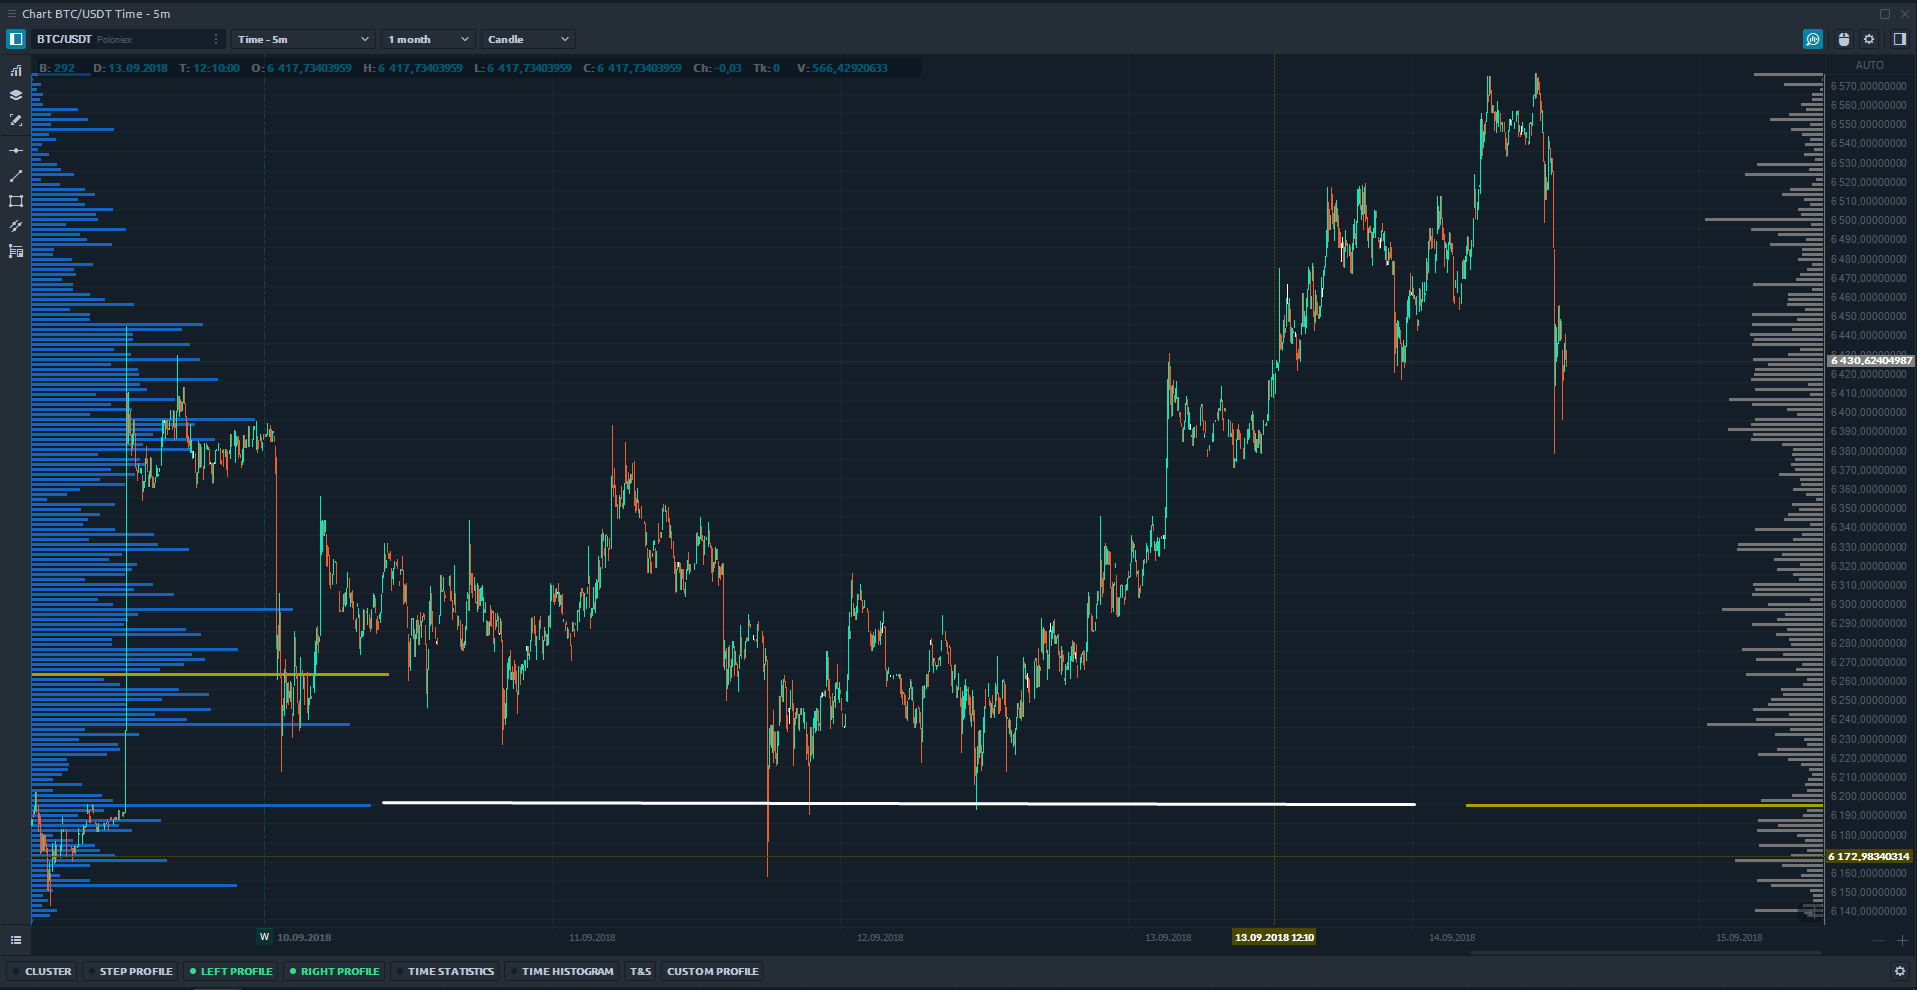
In conjunction with the indicator of trades distribution, it is very convenient to use the distribution of the average volumes of one trade (Average size). Let's switch the right histogram to the average trade size display mode.
The selected level of resistance/support corresponds to the maximum value of the average trade size, which certainly speaks about the interest of large traders in this level and further increases its significance.
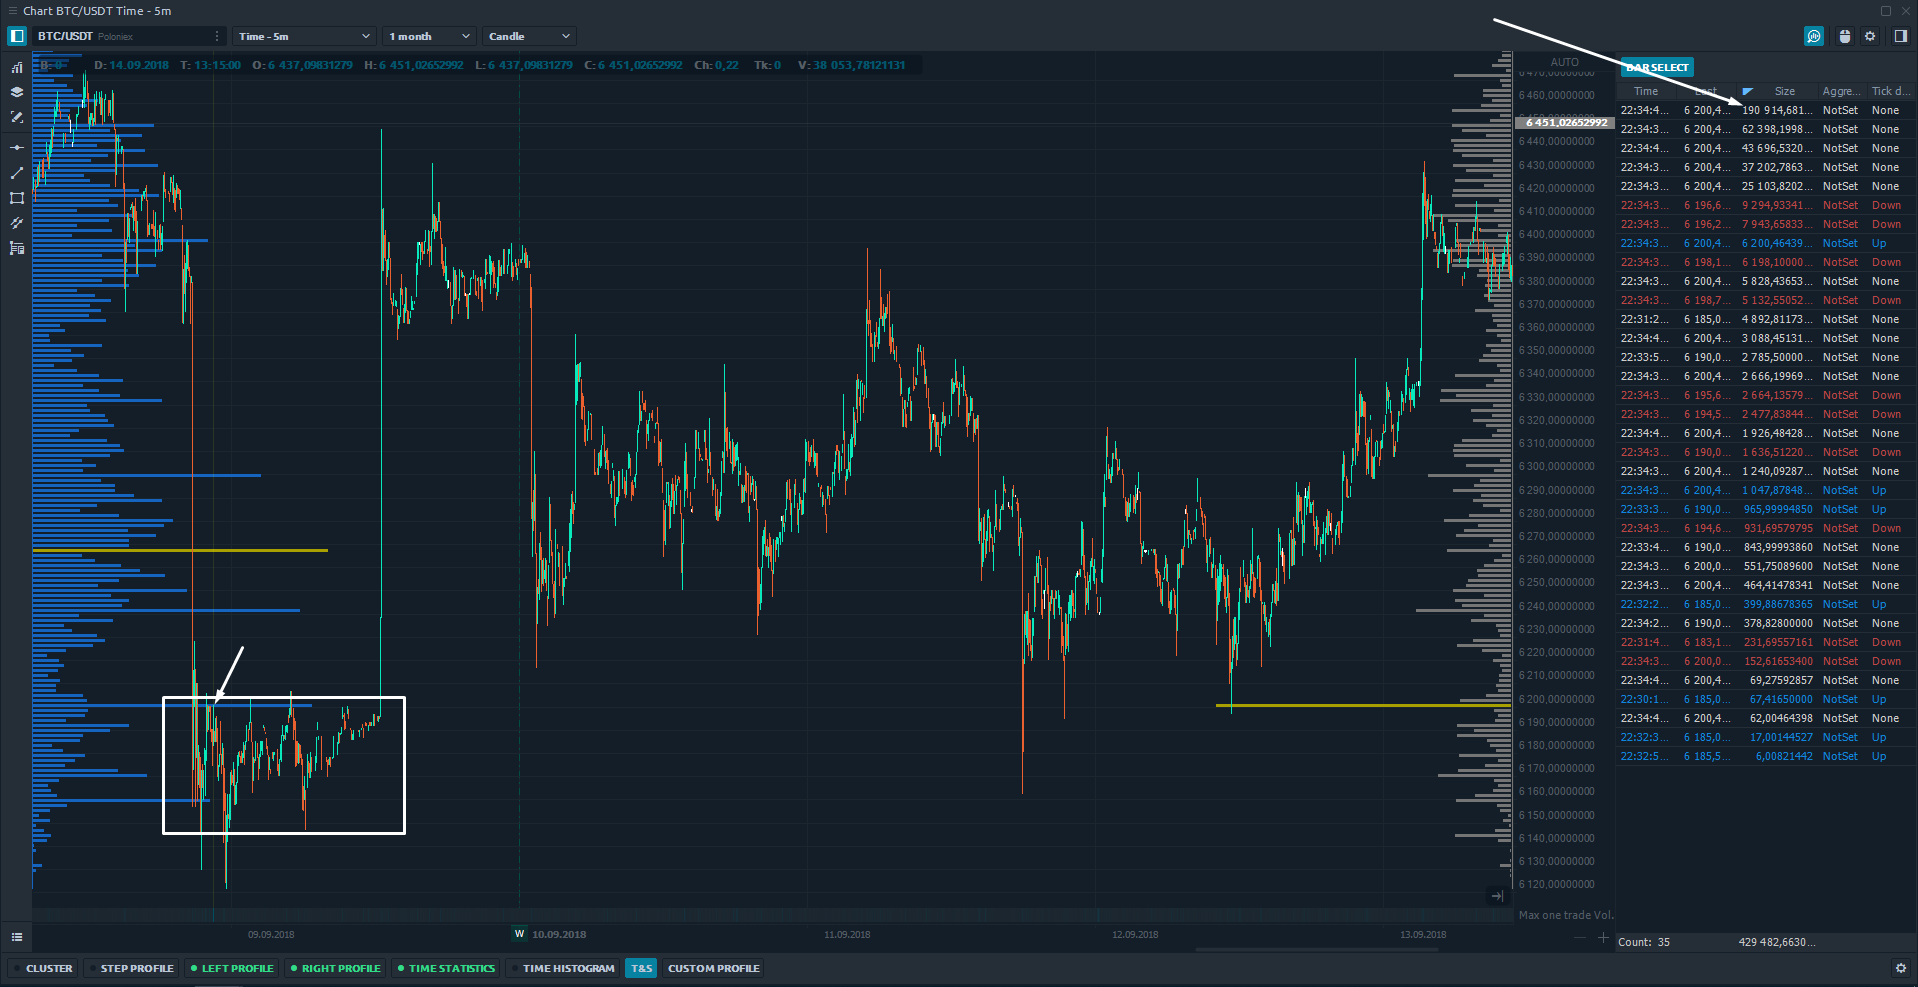
Continuing our analysis, let's switch the right histogram to the maximum volume in one trade (Max one trade vol) display mode and see what happens.
And again, at the selected level, we see that there was a maximum one-time trade, which confirms the fact of a major participant presence, and, most likely, it was the trigger that gave the start to the distribution stage.
Let's find this trade in history and understand the causal relationship using the Historical Time& Sales.
This trade was a part of the accumulation stage that occurred at the end of last week, after which there was a rapid distribution stage, and subsequently, the market used all the following week to use this zone as a strong support zone.
This behavior of the price says that the large participant protected his long position.
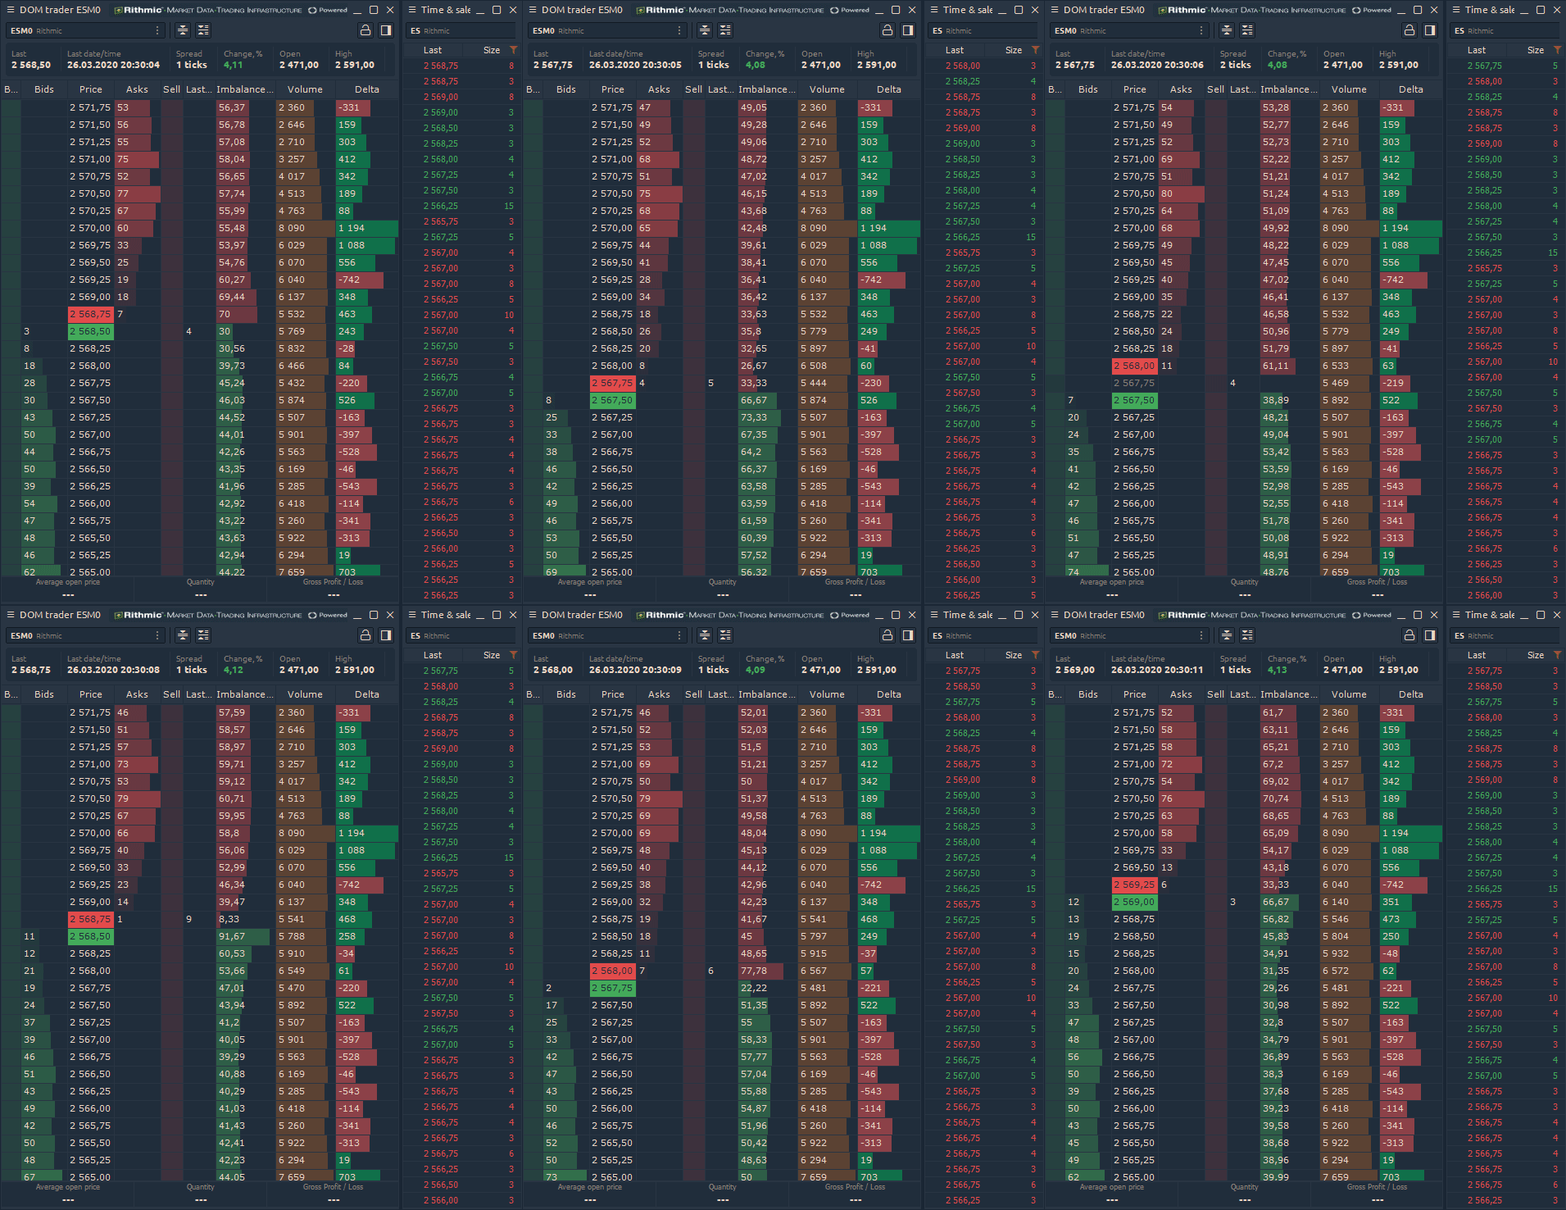
Delta metric — shows the difference between the volume of all trades, having an aggressor marker of purchase and all trades with an aggressor marker of sale.
Here it is necessary to give a small explanation. Each trade has two participants: the buyer and the seller. One participant entered the market using market order or an aggressive limit, the second one had a limit order in the DOM.
The aggressor marker is assigned to the direction of the market order or aggressive limit. For example, let's buy 10 lots at the market price and let's say that the counterparty has a limit order of 10 lots. Because of the purchase is made at the market, and the sale is made from the limit order, the trade will have an aggressor's marker of Buy.
The general formula can be described as follows:
Aggressor Buy: Last >= Prev. Ask
Aggressor Sell: Last <= Prev. Bid
Aggressor None: Bid < Last < Ask
The absolute value of the delta is primarily an auxiliary metric. The dominance of one of the market sides does not mean that the distribution stage will occur in the same direction.
In practice, the net delta indicators are used more often. These are the price levels at which all 100% of trades had the same aggressor marker, indicating, that all the participants completely made purchases/sales in the same direction at market price. This technique is used when the price goes to a significant level of resistance/support and from which a significant reaction is expected.
Conclusion. The volume, being the basis of the market structure, allows us to deeply understand the nature of processes that occur inside. Along with a large number of metrics and their combinations, volumetric analysis becomes a really powerful tool in the trading arsenal of the trader.


Comments